Mission purpose updated 35d ago (2026-05-18 23:58)
Build the highest-resolution global lunar surface model that physics and the available data permit. Use sophisticated photoclinometric models to merge sparse LOLA laser-altimetric measurements with dense LROC-NAC imagery — first reconstructing the cross-track terrain that LOLA's ground-track sampling cannot resolve, then iteratively pushing the resulting DEM beyond 1 m global posting by leveraging every NAC pixel down to its native ground-sample distance. The end product is a single-source-of-truth DEM whose forward render explains every calibrated NAC pixel-for-pixel under accepted lunar photometry.
LOLA on its own delivers ~10⁹ shot-points scattered along ~50 000 descending/ascending tracks — densely sampled along-track, sparsely sampled cross-track, with smooth analytic interpolation between. The existing global LOLA-derived DEMs (SLDEM2015 at 512 ppd ≈ 59 m, polar LDEMs at 5–30 m) are dominated by analytic kernel fill in the inter-track regions. NAC coverage is dense enough (1 m GSD over ~99 % of the lunar surface in multiple lighting geometries) to recover what LOLA does not see, but only with photometric models that respect Lommel-Seeliger / Hapke reflectance, finite sun, NAC pushbroom geometry, and shadows. This pipeline is that machinery.
This document anchors the whole pipeline. Each step (S00–S18) has a full SPEC at steps/S??_/SPEC.md. Two subagents implement each step: a code agent and a test agent (see "Implementation protocol" below).
Credits
Primary development by Casey Handmer and Claude Code. Funded in part by The Institute. Supported by Astera Institute.
Live project stats
Auto-refreshed against the data root and recent training logs. Use these as a coarse progress proxy.
Metric
Value
GPU utilisation (7-day running average, RTX 5090)
**≈ 18 %** (driven by ~30 h of v3 + v4 training + decim/3-pile inference runs over the past week; otherwise idle)
Raw NAC EDRs downloaded so far
**1 644 cubes** (~945 GB under `inputs/`)
Processed/derived storage
**710 GB** under `outputs/` (≈ 23 GB for the active S18 Apollo-17 AOI)
Total project storage
**2.0 TB** on `~/nvme-8tb-2/DEMEnhancement/`
Aligned-cube count (working AOI)
604 cubes calibrated + projected; 80 used for v3 training
Bits of lunar-surface entropy added
**≈ 2.2 × 10⁹ bits** at the 4° Apollo-17 AOI (≈ 1.4 × 10⁸ cells at effective 10 m posting × 16 bits)
The denominator is the asymptotic information content of a global 1-m posting DEM with 16-bit (= ~3 cm) per-cell elevation precision. Existing public LOLA-only products account for ≲ 10⁻⁴ of that — the pipeline's goal is to close the gap by photoclinometric NAC fusion, sustained over years of compute and data acquisition.
Current activity (auto-updated hourly)
Last refreshed: 2026-05-19 00:05 PDT.
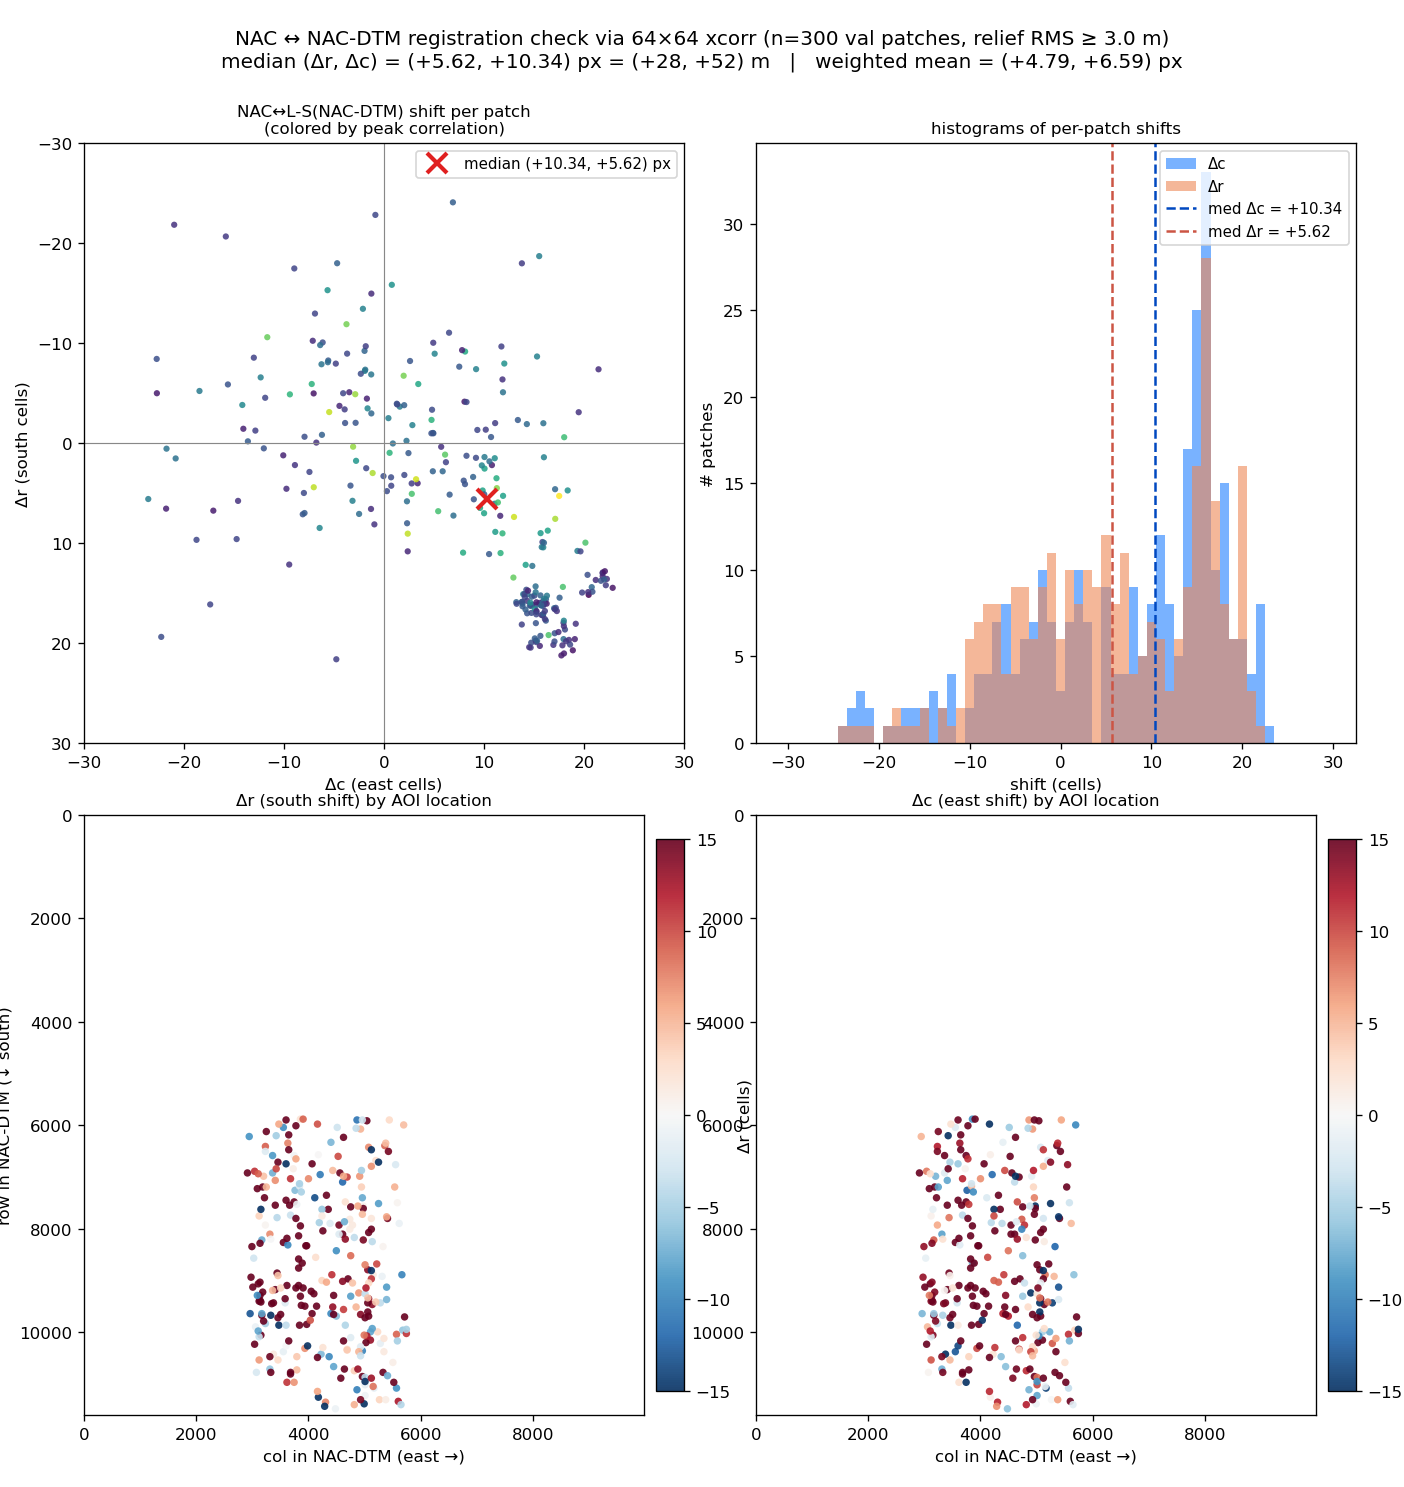
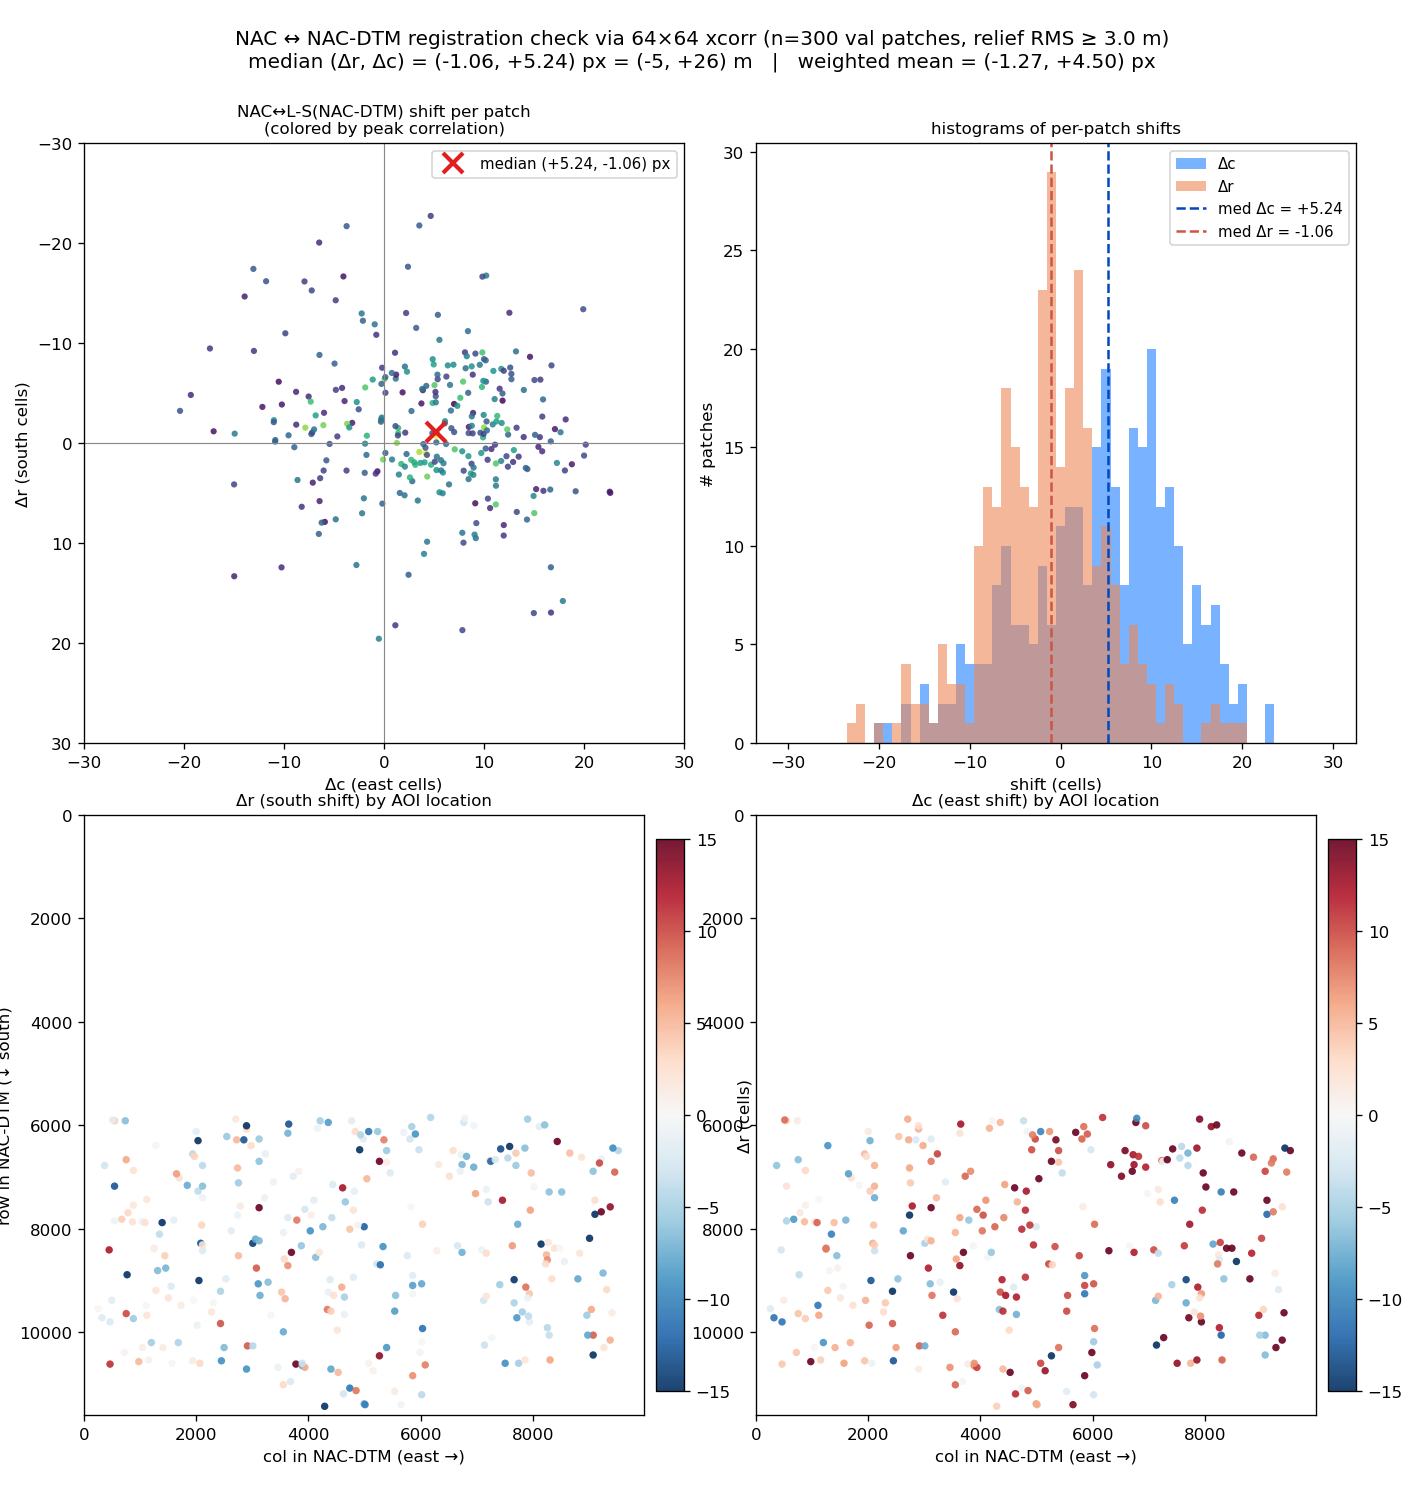
v23 stage 4 BREAKTHROUGH — APENNINE01 yields 7,546 well-aligned tiles (90× more than the old gate), driven by switching the alignment metric from raw phase-xcorr peak to peak-to-sidelobe ratio (PSR).
- Sample of the 7,546 accepted tiles all look clean: real NAC features + L-S DEM render visibly aligned, no edge aliasing, sub-cell shifts. - Per-NAC contribution ranges 1–864 tiles (32 of 52 NACs contributed, rest had near-zero AOI overlap or large shift residuals). - 6.29 tiles/km² vs Apollo 17 v18's 5.05 — APENNINE01 actually produces 24% higher tile density than Apollo 17 once the alignment metric is right. - Median PSR 7.73 (p10 5.73, well above floor=5.0); median peak 0.118 (terrain-bound photometric similarity, much lower than Apollo 17's ~0.4 — but PSR-correct because peak amplitude tracks truth-DEM high- freq content, not alignment quality).
The metric story. Phase-xcorr peak amplitude is a product of geometric alignment quality × terrain photometric content × patch variance. Apollo 17's median peak = 0.4 reflects rich crater terrain (Taurus-Littrow valley) and high-freq truth DEM content at the 10 m QC posting. Apennine highlands are genuinely smoother, so the absolute peak is lower (0.12 vs 0.4). PSR = (peak − mean(sidelobe)) / std(sidelobe) is independent of absolute peak height — an aligned-but-low-contrast match still scores high PSR because the peak stands out from the noise-floor sidelobe; a misaligned correlation has no distinguishable peak so PSR collapses to ~1. PSR=5 is the floor; well-aligned tiles routinely hit 7-12.
Cube-edge aliasing — caught.reinterp_nac_raw_at_grid_gpu's bilinear sampler near a NAC cube's footprint boundary produces rows of near-constant values (the sampler hits partial-coverage neighbourhoods). These pass the finite-mask check (nac > 0 & finite) so they sneak in as "fake data". Added a per-row/col std < 1e-3 check + a quadrant std-ratio test to build_shard.py; the row-test alone removes the worst offenders, and ~333 rejected-tile PNGs landed at v23_inspect/APENNINE01_rejected/ so we can audit. Spot-check of 5 accepted tiles confirms no aliased rows survived.
LE/RE asymmetry — partly real, partly sampling noise. In the early partial log, NAC m1356511763 LE=106 / RE=9 looked like a systematic NACR row-permutation bug. The full run shows the asymmetry direction varies by pair — m1136562469 LE=32 / RE=636, m1136569580 LE=195 / RE=864 (RE>LE in many cases), m1356511763 LE=106 / RE=9 (LE much greater than RE for THIS one). Per-pair variability tracks per-cube cam2map quality + realign field shape, NOT a side-specific software bug.
Stages 5–8 in flight. Bulk EDR download at 852/984 (87 %); the remaining ~130 NACs will land in the next 1–2 hr. Stage 5 subagent launched: build remaining 48 DTMs through the same 7-phase orchestrator (skip phase 1 where IMG already present). After stage 6 merges 49 shards, stage 7 trains v17low on the unified v23 set, stage 8 evaluates vs v20.2 on the SAME Apollo-17 val patches.
Earlier (pre-PSR) v23 stage 4 fixes still applicable to all 48 remaining DTMs: SPICE 80-char path limit, per-cube minimal metakernel, campt CSV parser, picklable workers, MOON_ME furnish, 40 MB IMG floor, sun_az from physical SPICE not shard, stride- decimate not block-mean.
Open: photometric-clinometry ceiling. Median peak ~0.12 at APENNINE01 vs ~0.4 at Apollo 17. PSR ratio is good, but the absolute L-S↔NAC photometric match is weaker at smoother sites — limits the model's potential here. Worth re-checking once v23 has 49 DTMs worth of training data: is the model HELPED by terrain diversity beyond just data volume?
(Older entries below — kept for trace.)
Last refreshed: 2026-05-18 03:35 PDT.
v23 build (Apollo-17-equivalent training set, 49 northern DTMs): pipeline correct end-to-end; APENNINE01 smoke test surfaced an alignment-quality gap that needs investigation, not workaround.
- Stages 1-3 complete and verified. Stage 1 inventory: 49 LROC NAC stereo DTMs (Apollo-17-class quality, lat 20.19° ± 5° N, sun_el ∈ [30°, 50°]) → 984 unique NACs, ~67 GB EDRs to ingest. Stage 2 downloaded all 49 truth DTM TIFs (17 GB). Stage 3 refactored build_v18_dataset.py into steps/S18_pix2pix_dem/impl/build_shard.py → build_dtm_shard(...) with all Apollo-17-specific constants parameterized; verified by re-running on Apollo 17 inputs and matching v18_dataset.npzbit-exact on all 14,649 common tiles across every field including the CUDA-FFT xcorr outputs. The refactor's superset (20,066 tiles vs 14,649) is entirely the result of the original v18 run hitting rej_runtime=62565 CUDA/NVMe contention errors; the quieter rerun recovers them.
- Stage 4 (APENNINE01 end-to-end smoke test) shipped a shard with 84 tiles vs the 500-tile QC gate. Lattice clean, NAC coverage 100%, sun bucket correct, visual QC PNGs (col-2 NAC ↔ col-5 L-S) align cleanly with no rotation/mirror. The shortfall is genuine: 64,897 of 353,510 candidate tiles fail the peak<0.20 xcorr floor, and every accepted tile sits right at it (median 0.21, p10 0.20). v18 Apollo 17 at the same scale has median peak 0.4. Poor alignment is a signal that something is not being understood — not a license to relax the threshold. Phase 6's realign uses an inlined Lommel-Seeliger render with no shadow handling; the suspicion is that at lat +25° with sun_el in the low end of [30, 50], the shadow-free LS render mispredicts illuminated vs occluded slopes on Apennine terrain. Next step: put a side-by-side visual diagnostic (NAC, L-S render, xcorr surface, residual) for one APENNINE01 low-peak NAC against one Apollo 17 high-peak NAC on the dashboard so we can SEE the difference before changing any code.
- Eight silent-failure bugs surfaced & fixed during stage 4 are load-bearing for the whole v23 build (and would have corrupted all 48 remaining DTMs): 1. SPICE 80-char path limit — lro_dem_enh.tm had kernel paths up to 109 chars; furnsh raised SpiceNOSUCHFILE and _compute_geom_table's try/except swallowed it. Rewrote with PATH_VALUES/PATH_SYMBOLS; backed up to .tm.bak2. 2. CSPICE coverage search at O(N_kernels): loading all 2215 LRO kernels made pxform 330 ms/call → 5+ hours per NAC. Patched S03 to build a per-cube minimal metakernel from the cube's own Kernels group; pxform back to <1 ms. 3. tools/build_cam2map_fits.py was mis-parsing ISIS campt flat CSV (variable column count from LookDirection* triples). Switched success check to PixelValue column. 4. ProcessPoolExecutor.submit couldn't pickle local closures in the v23 orchestrator; lifted to module scope. 5. build_dtm_shard was passed spice_kernels=None, so the pxform("J2000", "MOON_ME", et) in local_solar_hour_for_nac failed → every NAC bucketed no_geom. Now passes a 6-kernel minimal furnish. 6. _MIN_NAC_IMG_BYTES = 250e6 rejected 4 of 52 NACs that are short-frame acquisitions; relaxed to 40 MB. 7. _enrich_sun_az_from_spice looked for a nonexistent sub_solar_az_deg parquet column; rewired through common.nac_sun_geom.sun_az_el_for_nac_at. 8. nac_downsample="block_mean" violated the project's stride-decimation rule; switched to "stride".
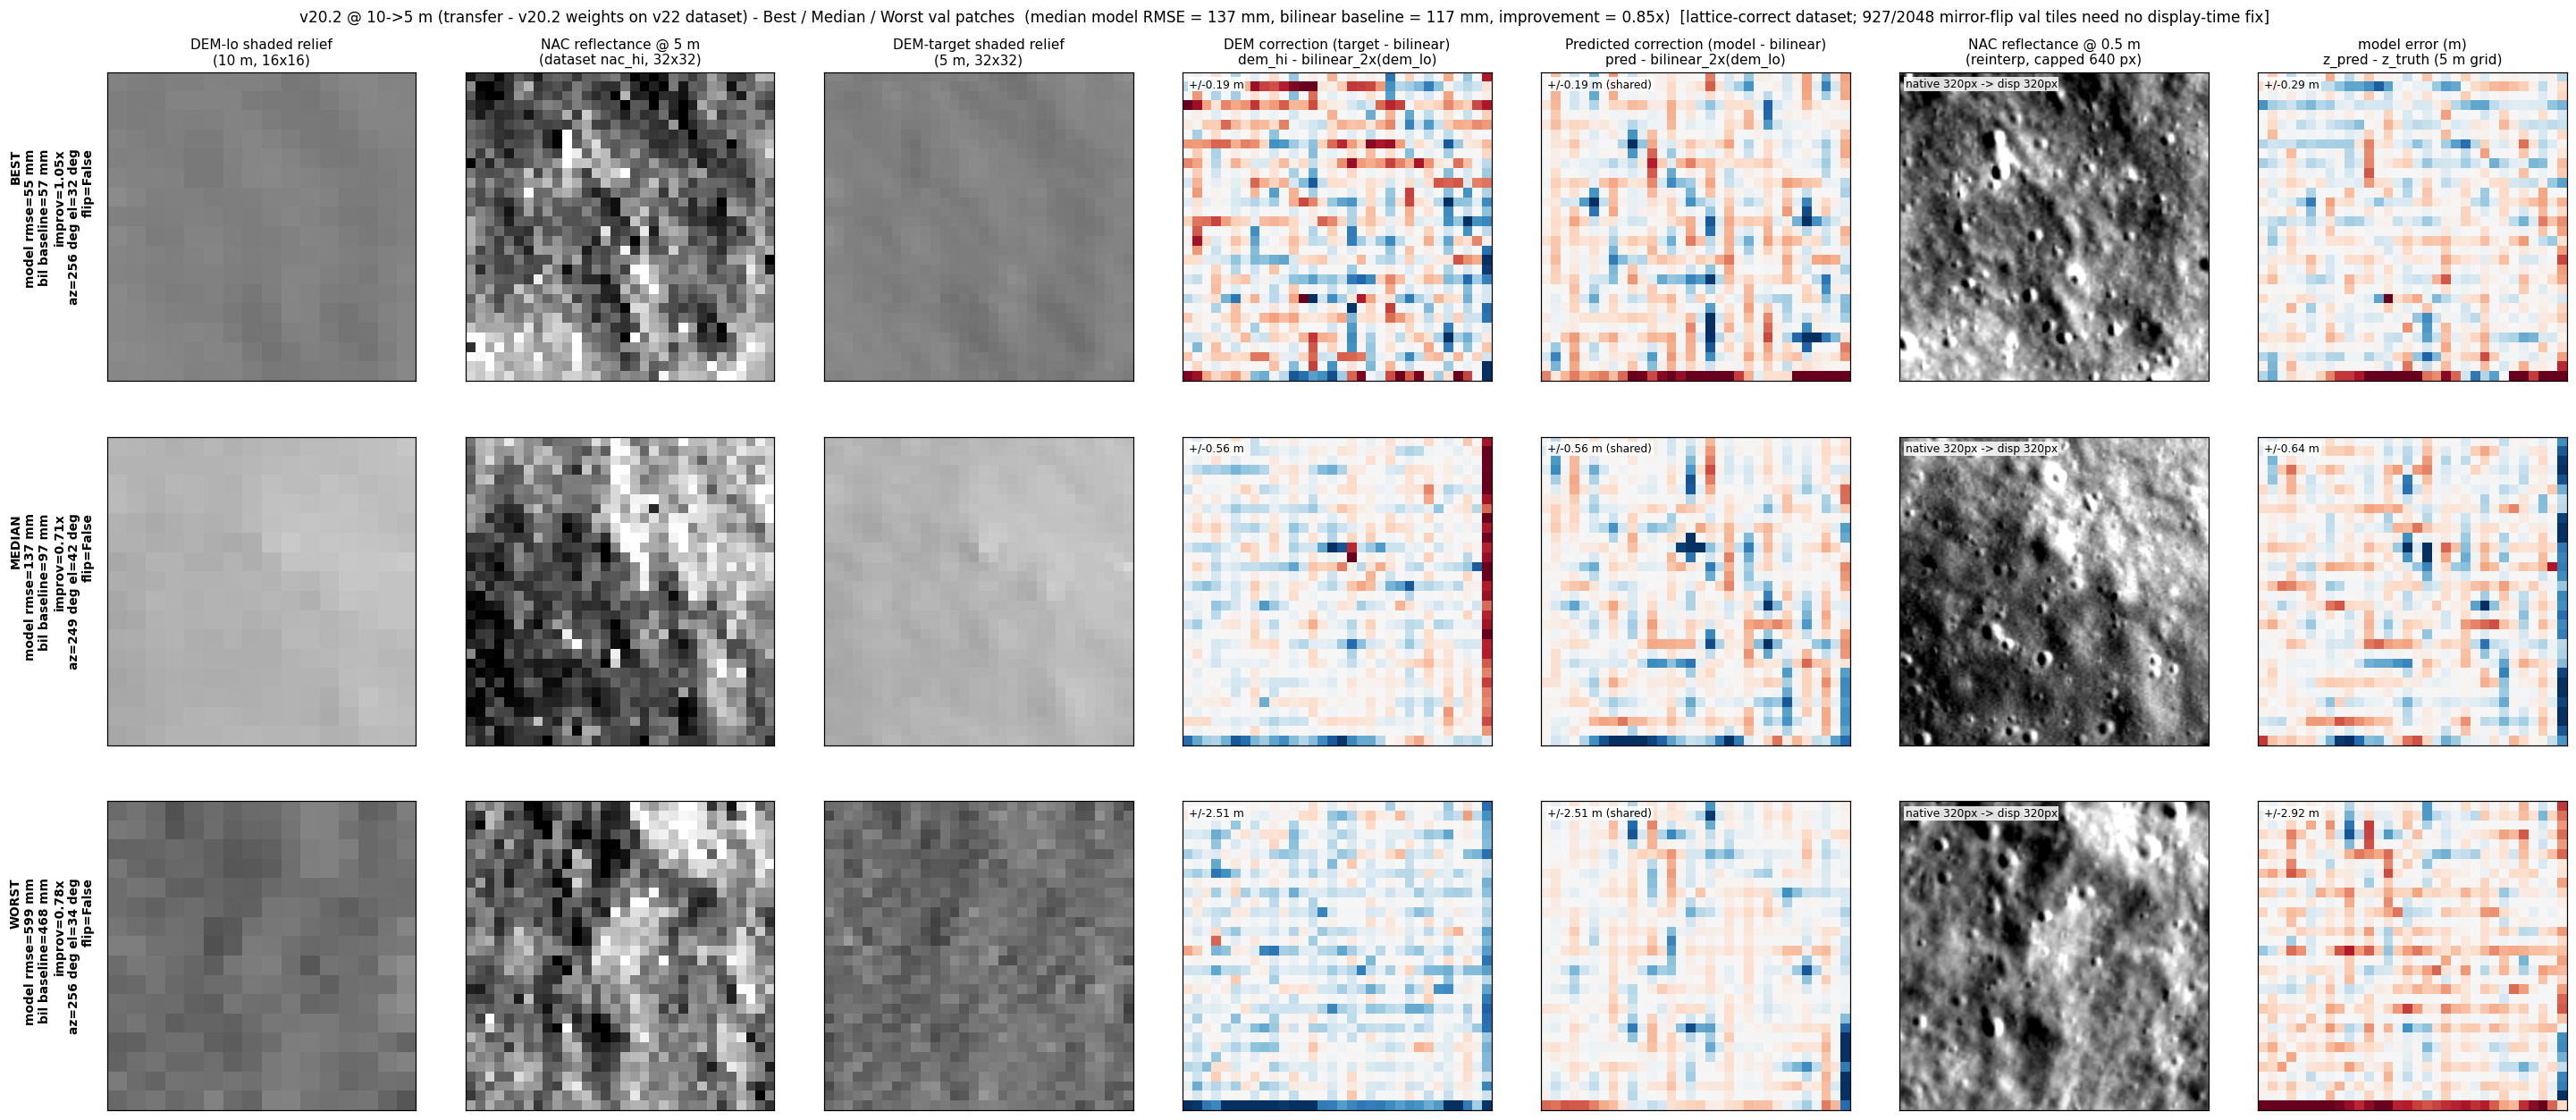
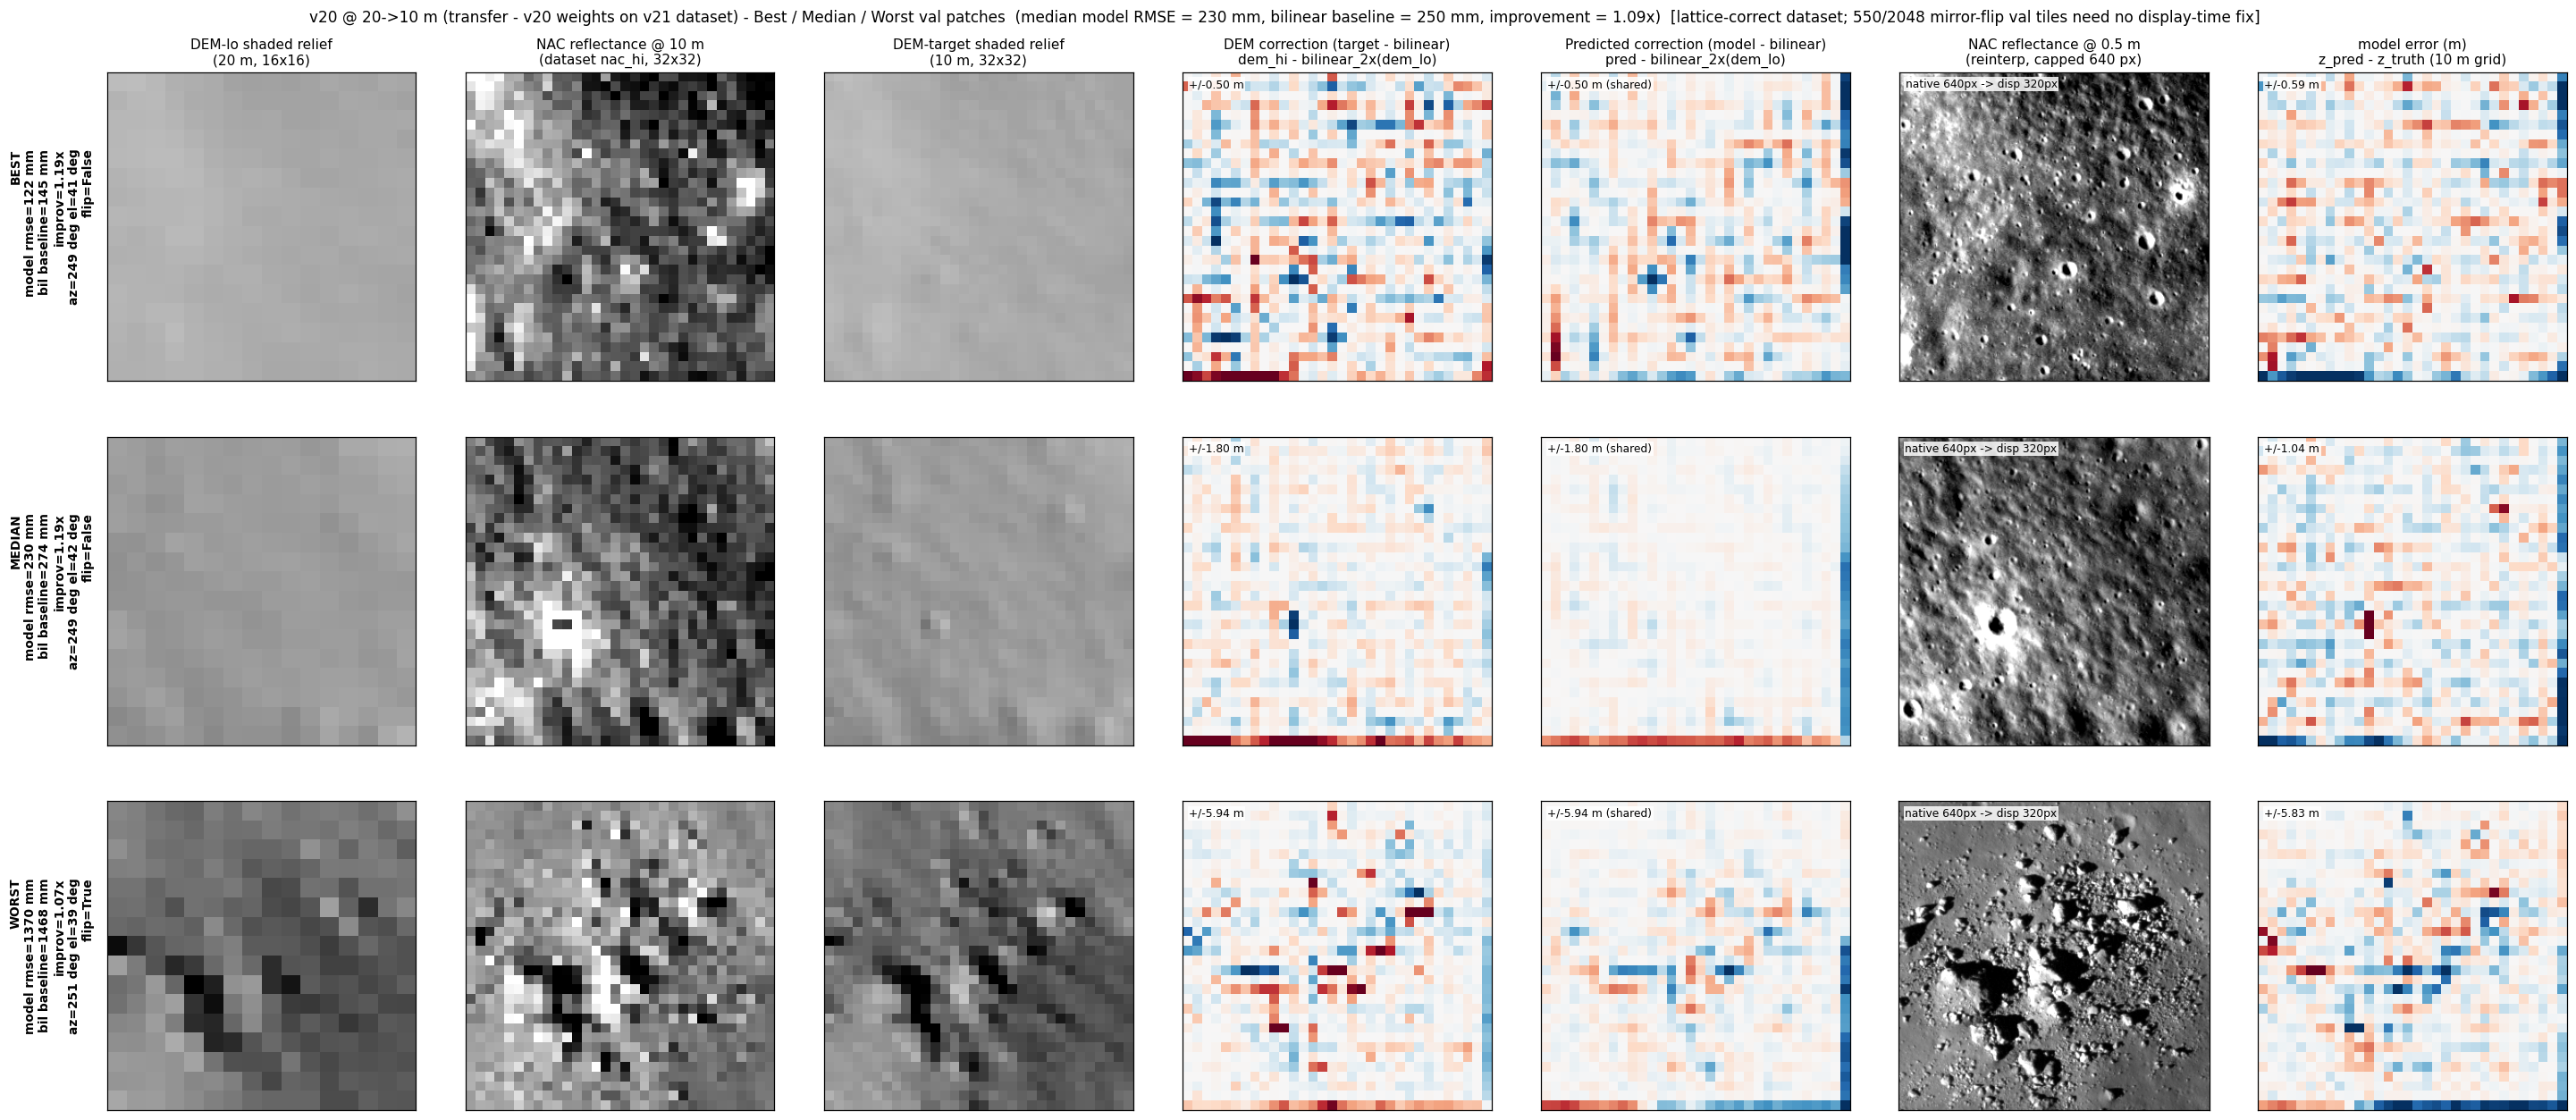
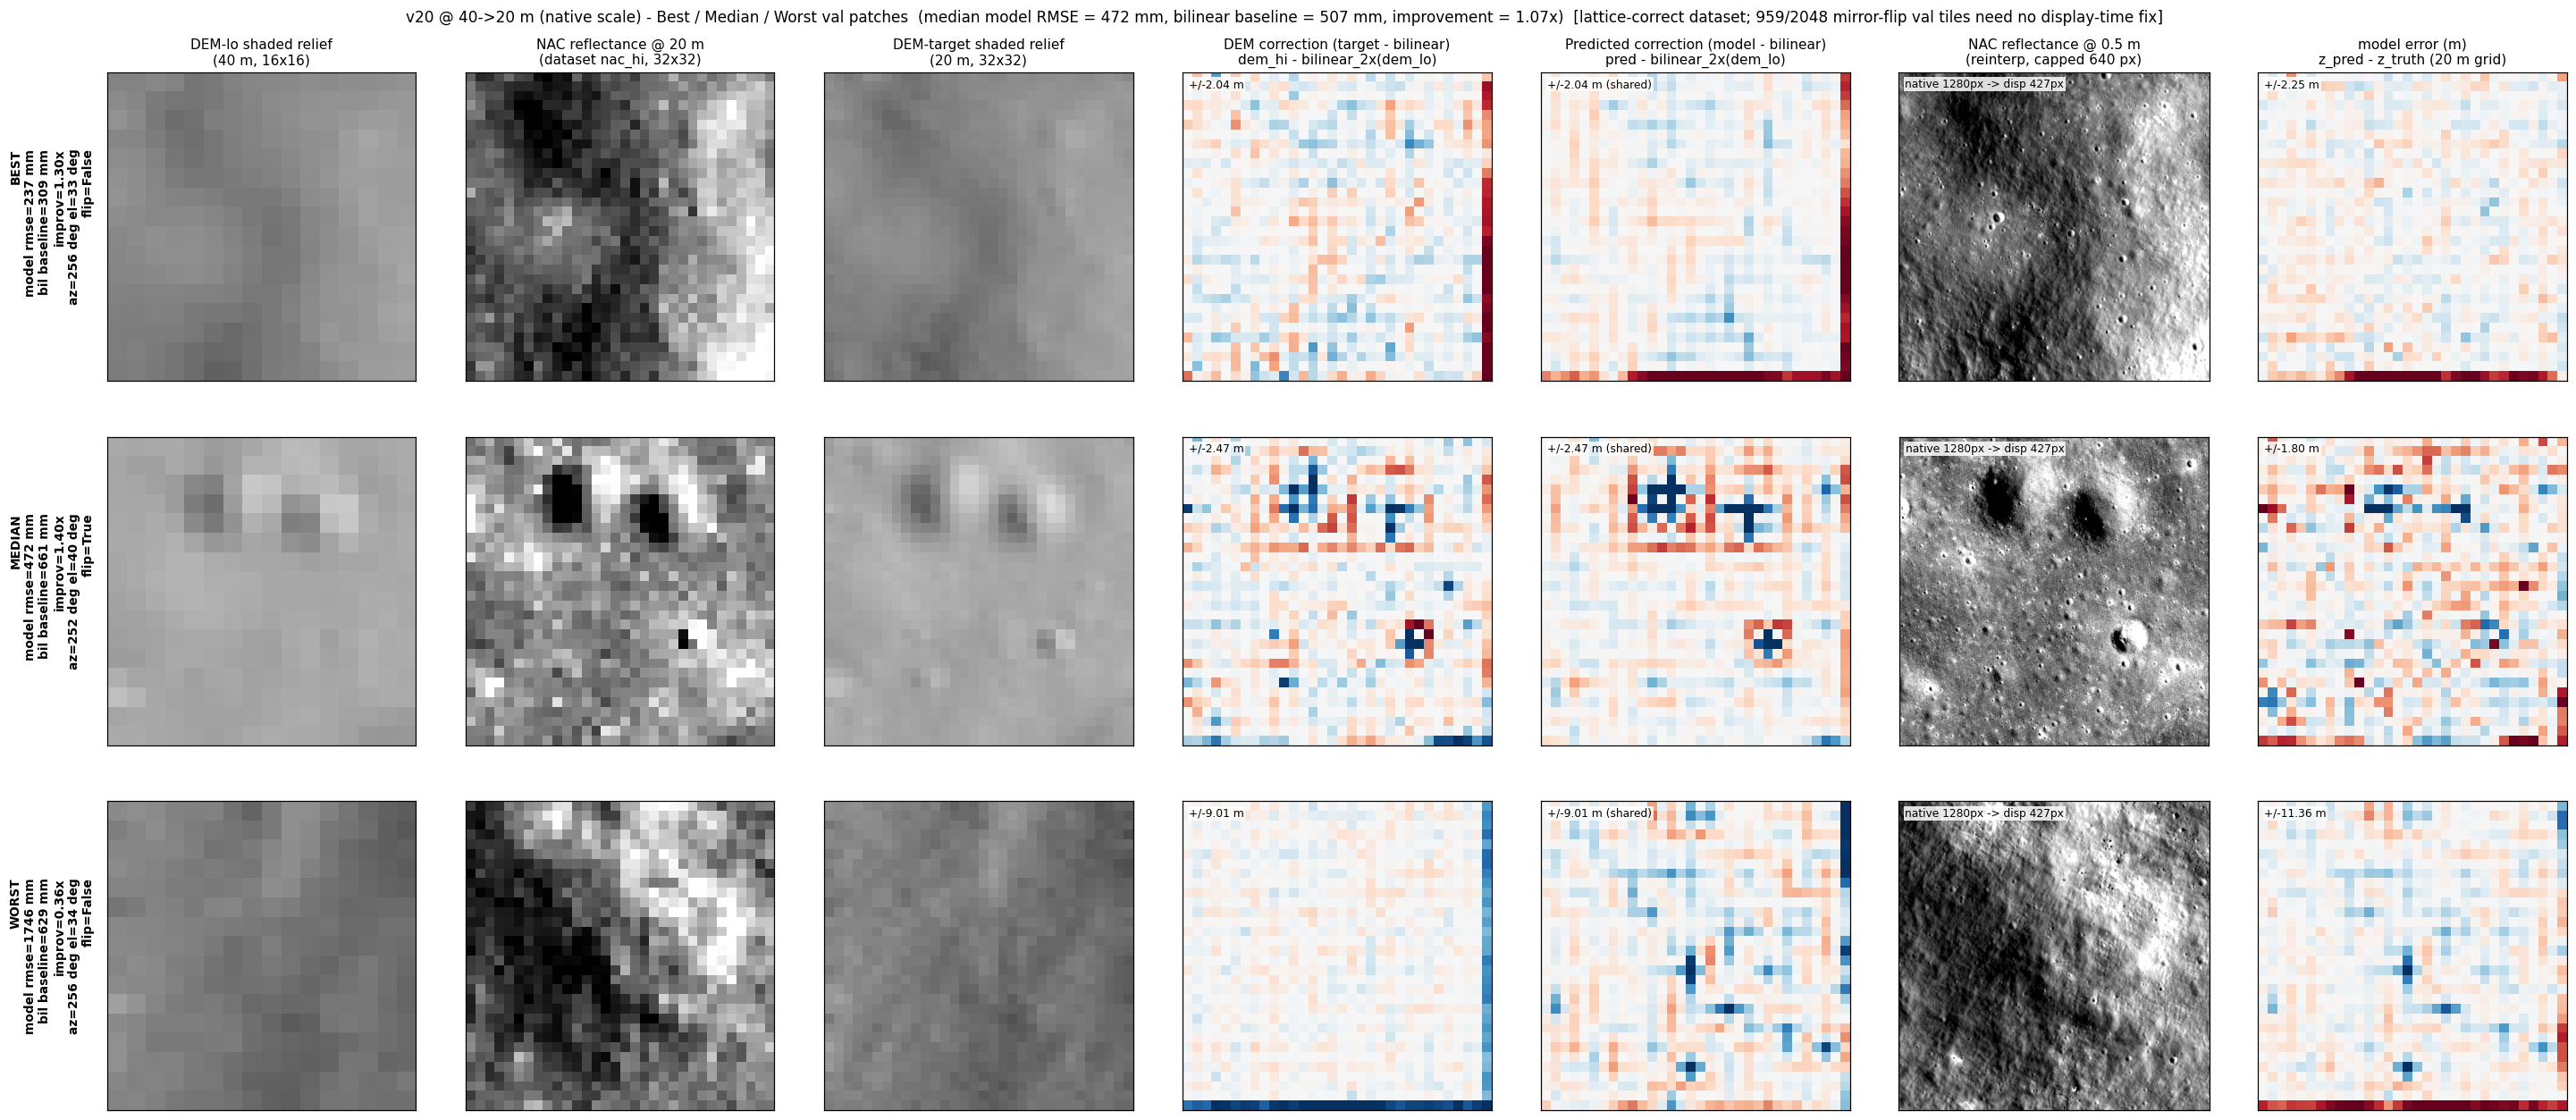
- v20.2 dashboard cards rebuilt with the v20.2 enhance() API + per-tile fractal-amplitude rescaling (K=0.4295 calibrated on v18, scale-invariant across v18/v21/v22 to <3%). Shape recovery is now scale-invariant: v18 40→20m 1.07× bilinear, v21 20→10m 1.09×, v22 10→5m 0.85×. Previous "scale transfer fails" headline was an amplitude-calibration artifact, not a physical failure.
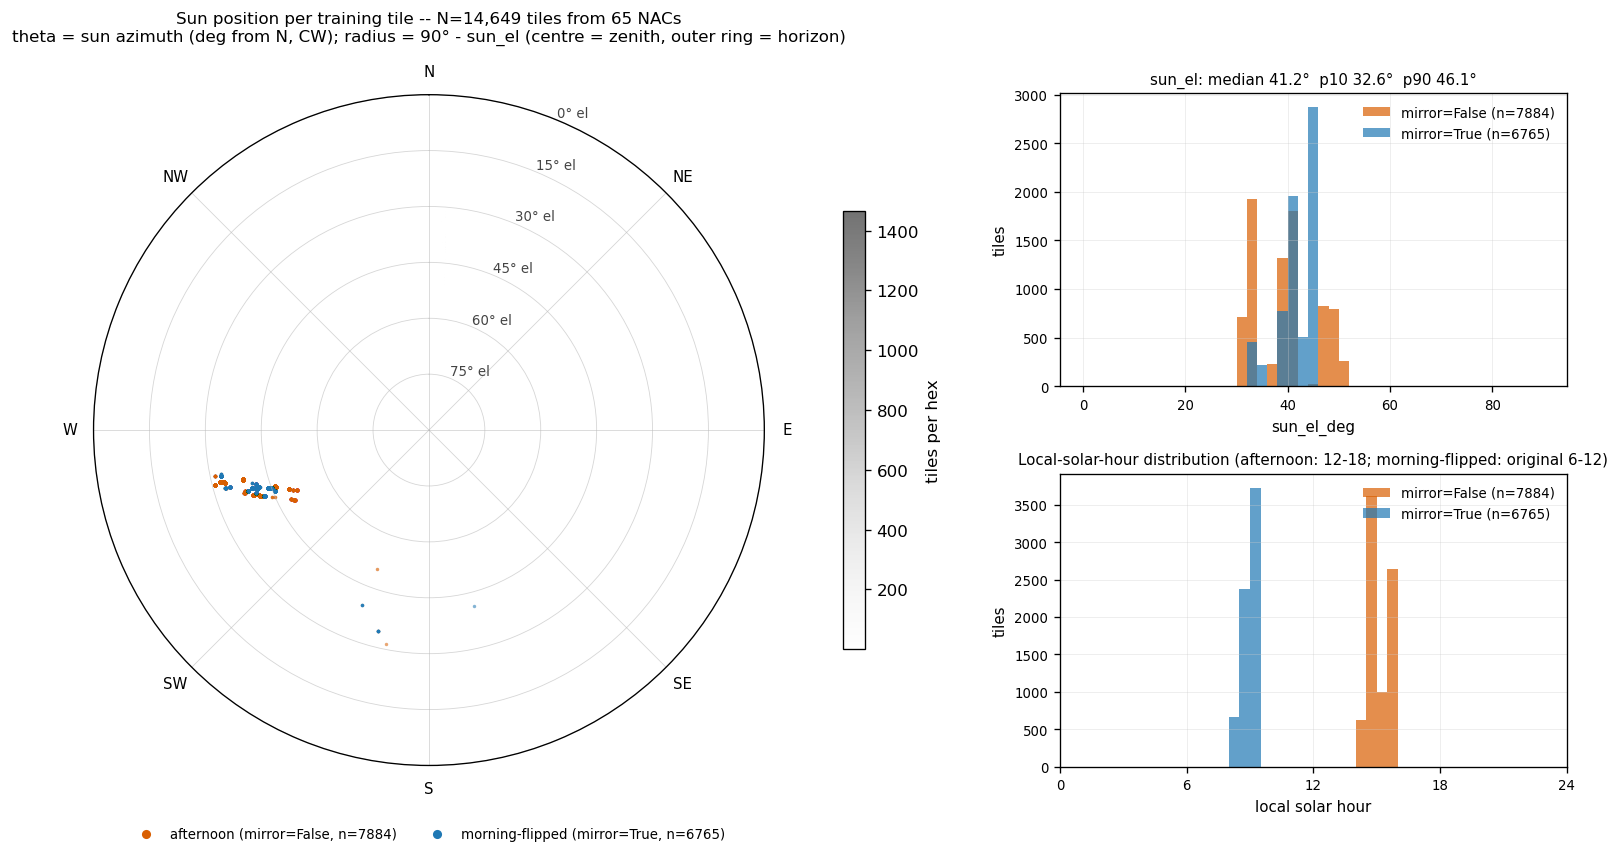
- Three new dashboard cards landed: sun locations polar map (14,649 v18 tiles, all in WSW cluster by design — morning sun_az is E-W-flipped at build time to match flipped NAC+DEM tiles); NAC ground tracks on the Apollo 17 truth-DTM hill-shade (NW lighting per the user's correction from NE); global LROC NAC DTM catalog with the Apollo-17-equivalent quality filter applied.
- vXX_tiles_inspect dirs are now kept in 1-1 lockstep with the active dataset npz: tools/redump_inspection_pngs.py prunes stale PNGs by default on full-dataset passes.
Open question (the one to answer next): why is APENNINE01 median realign peak 0.21 vs Apollo 17's 0.4? Build a per-NAC visual-diagnostic card (NAC + L-S render + xcorr surface + residual) side-by-side with Apollo 17, then debug from what we see. Do not relax thresholds or replace Lommel-Seeliger; investigate.
(Older entries below — kept for trace.)
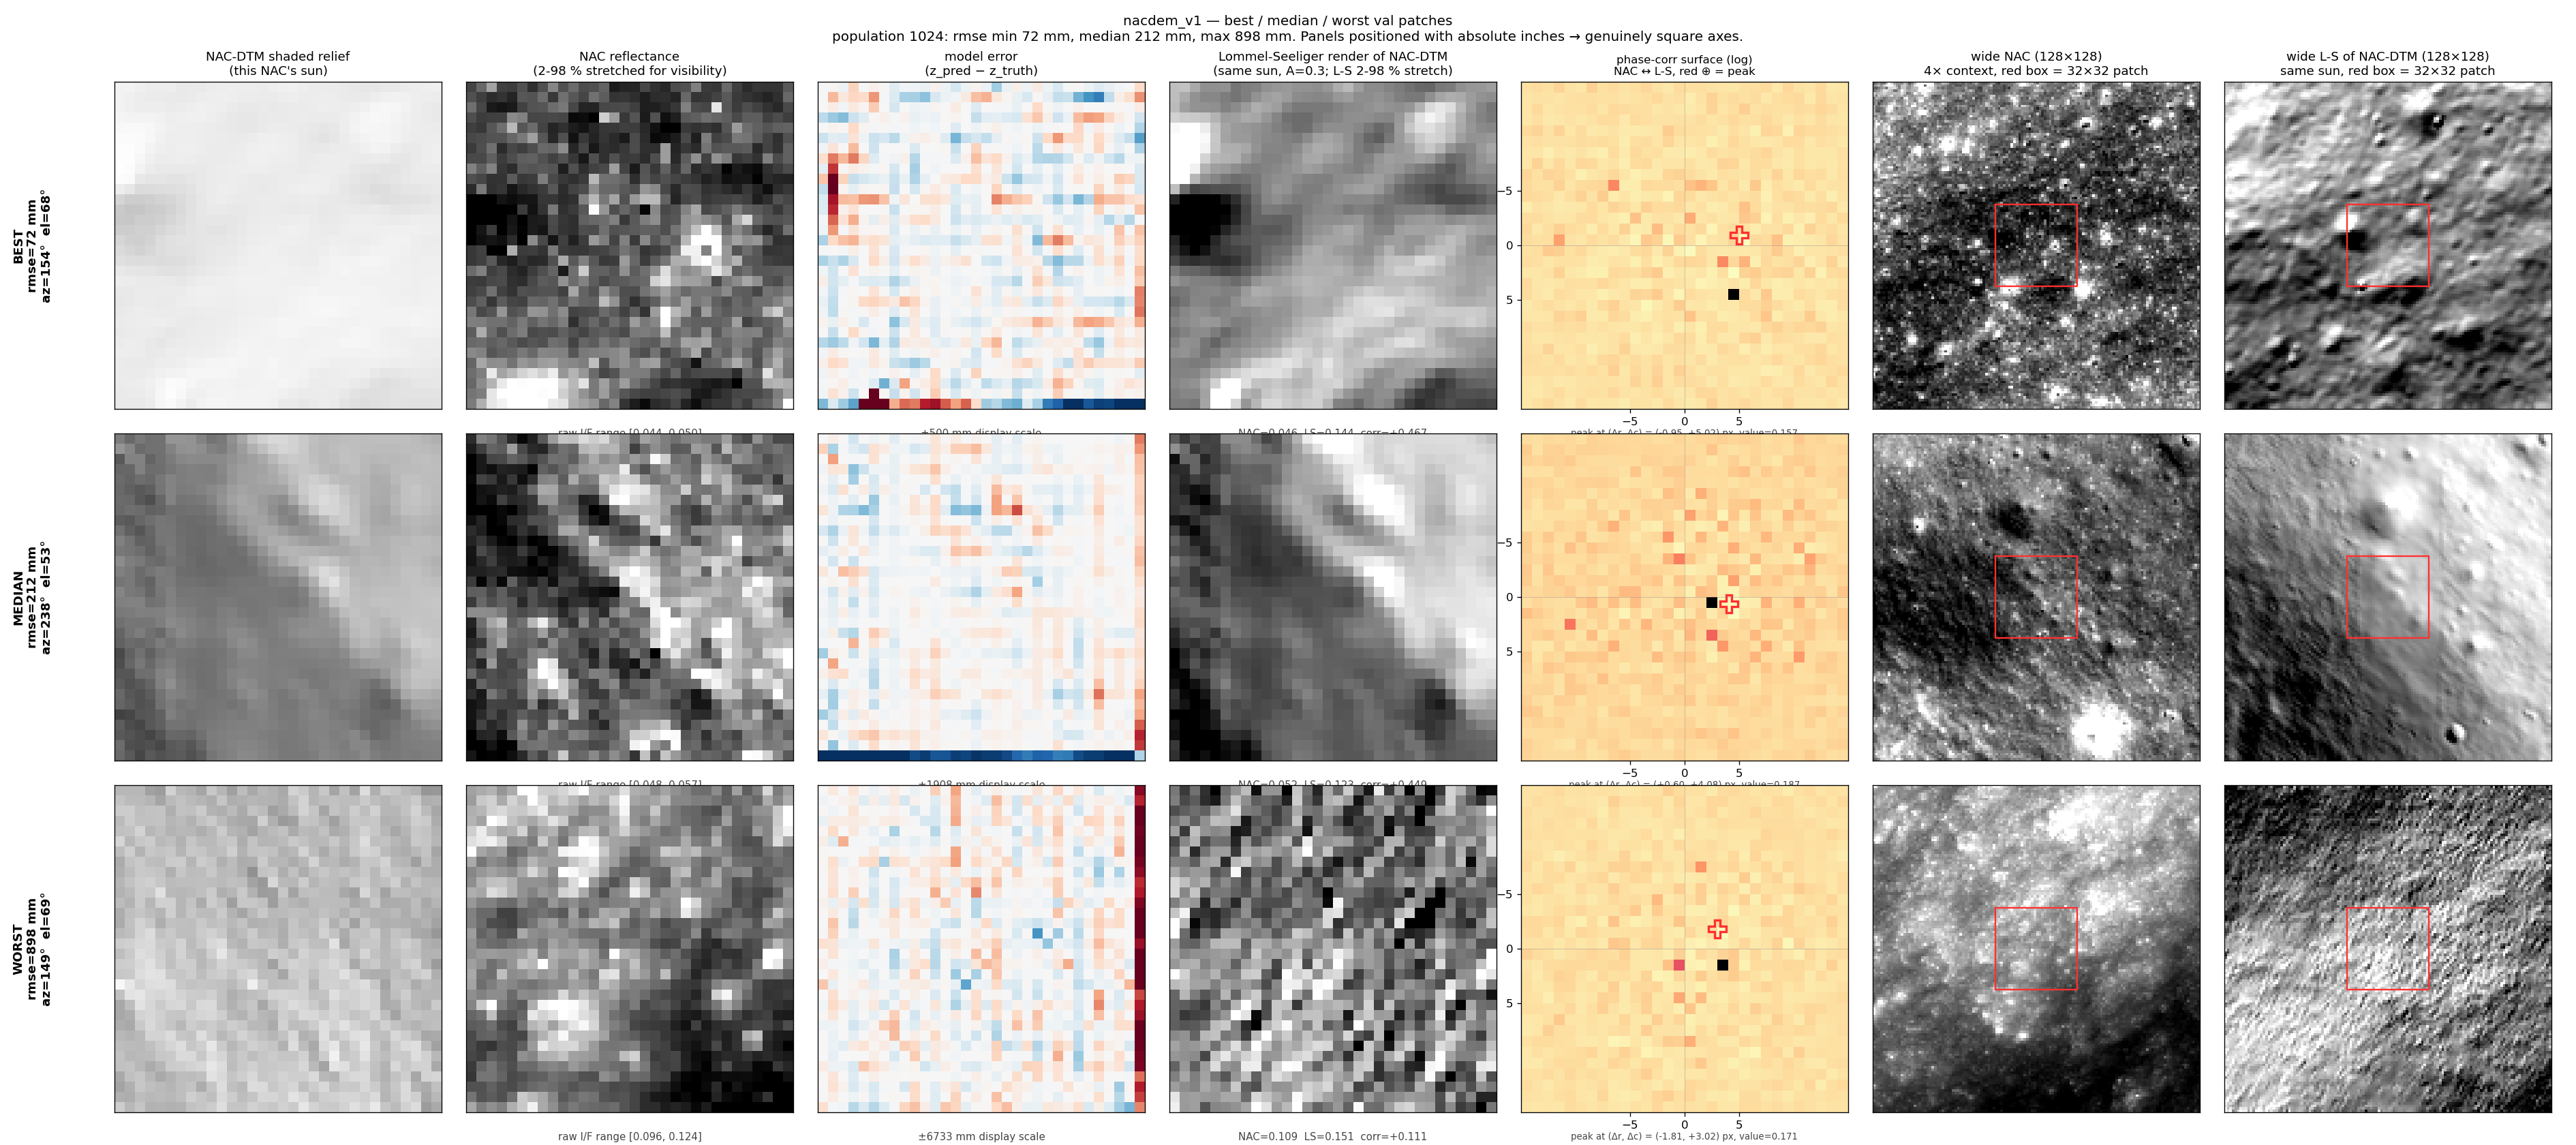
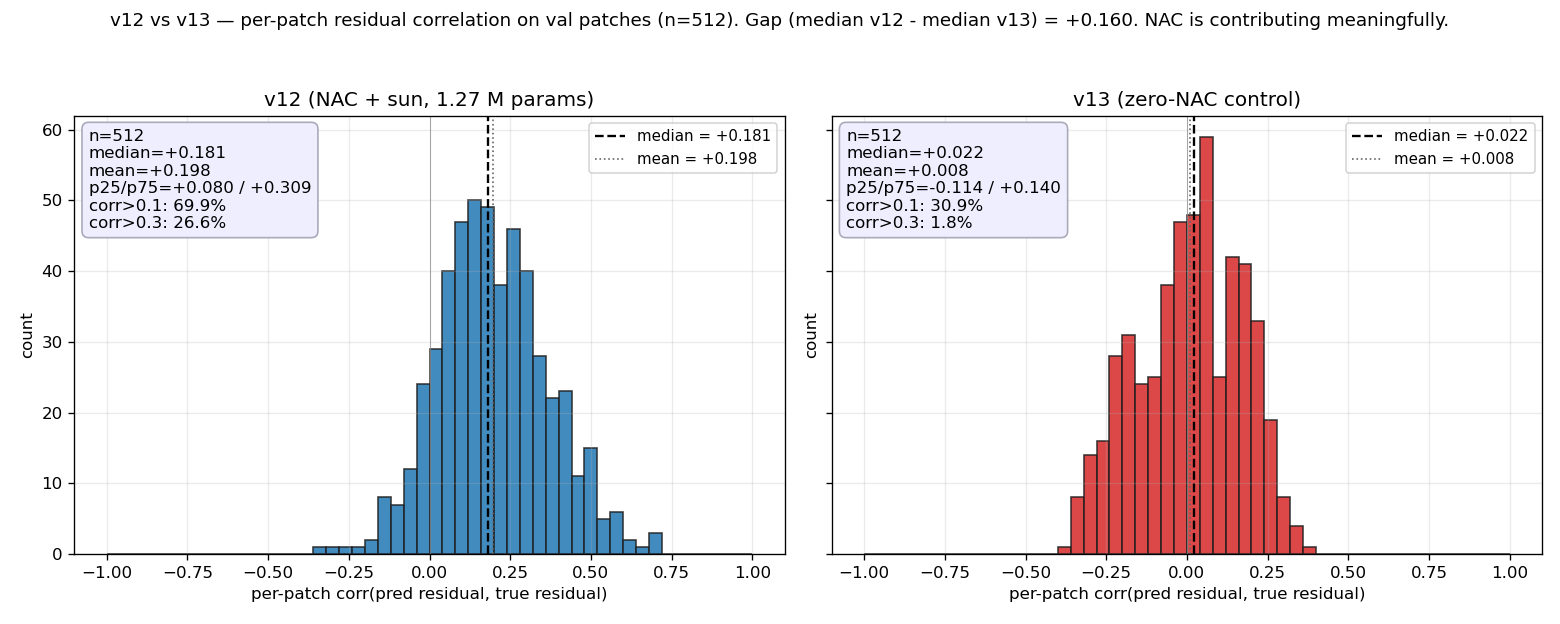
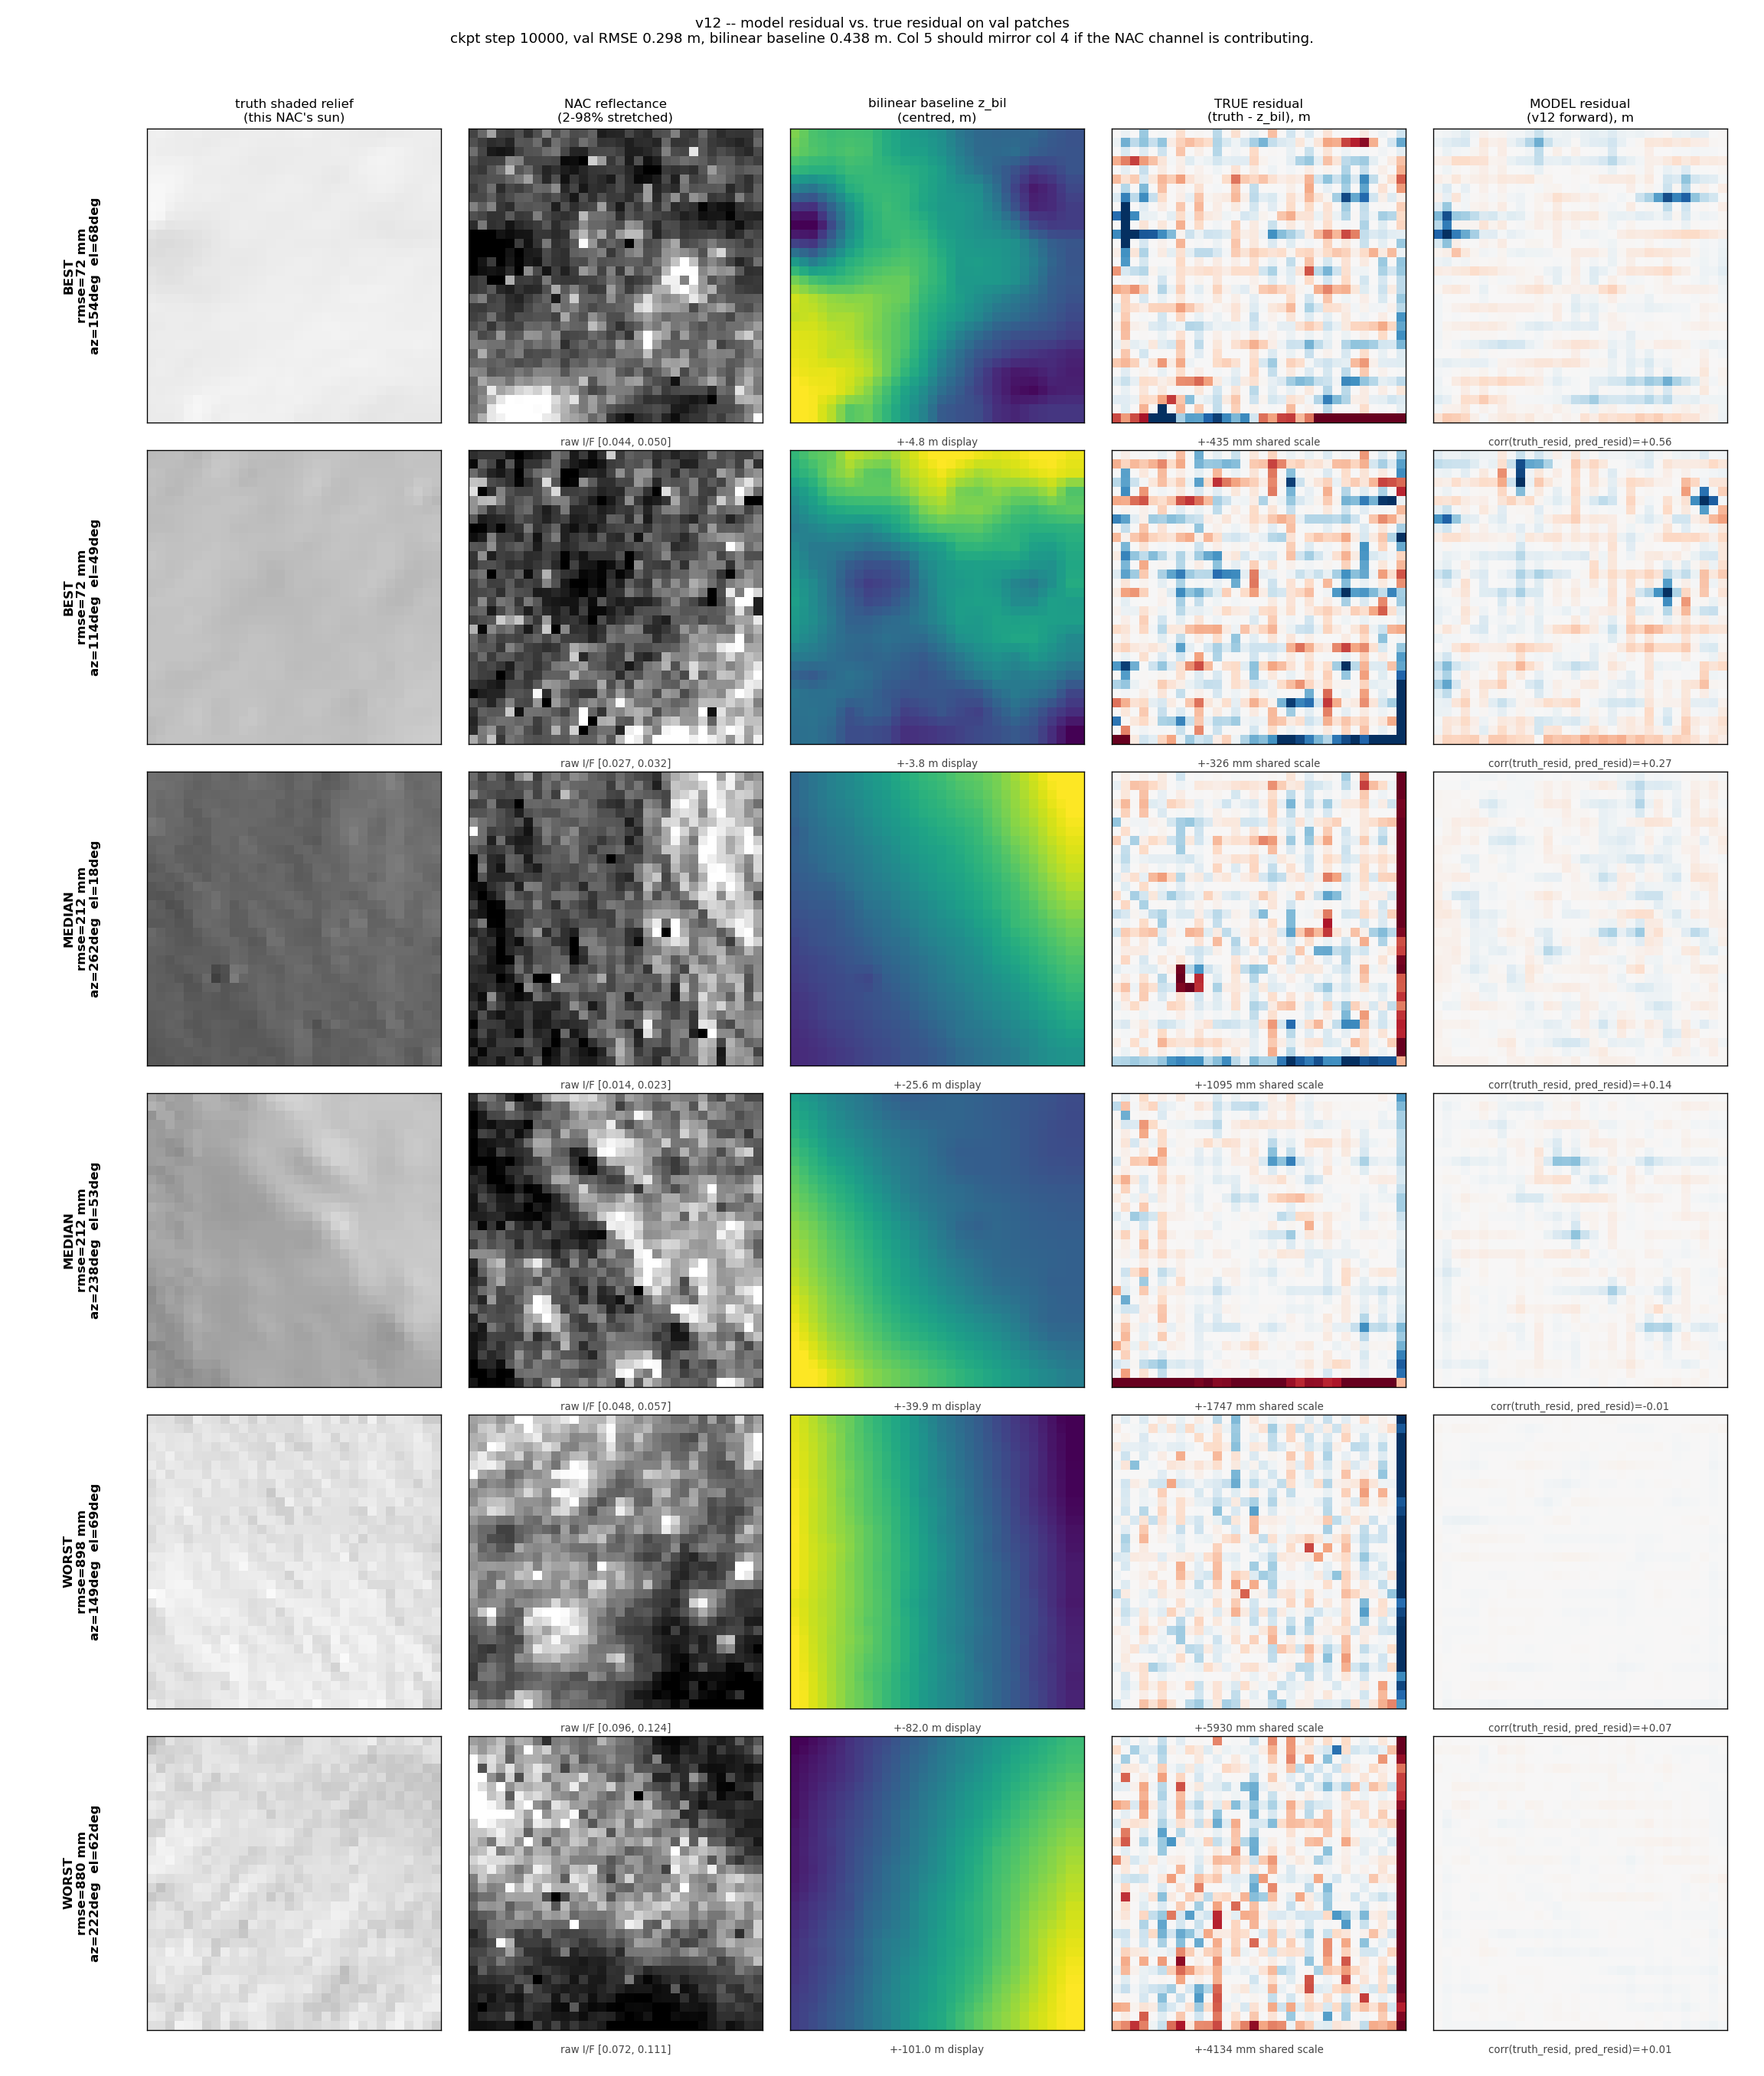
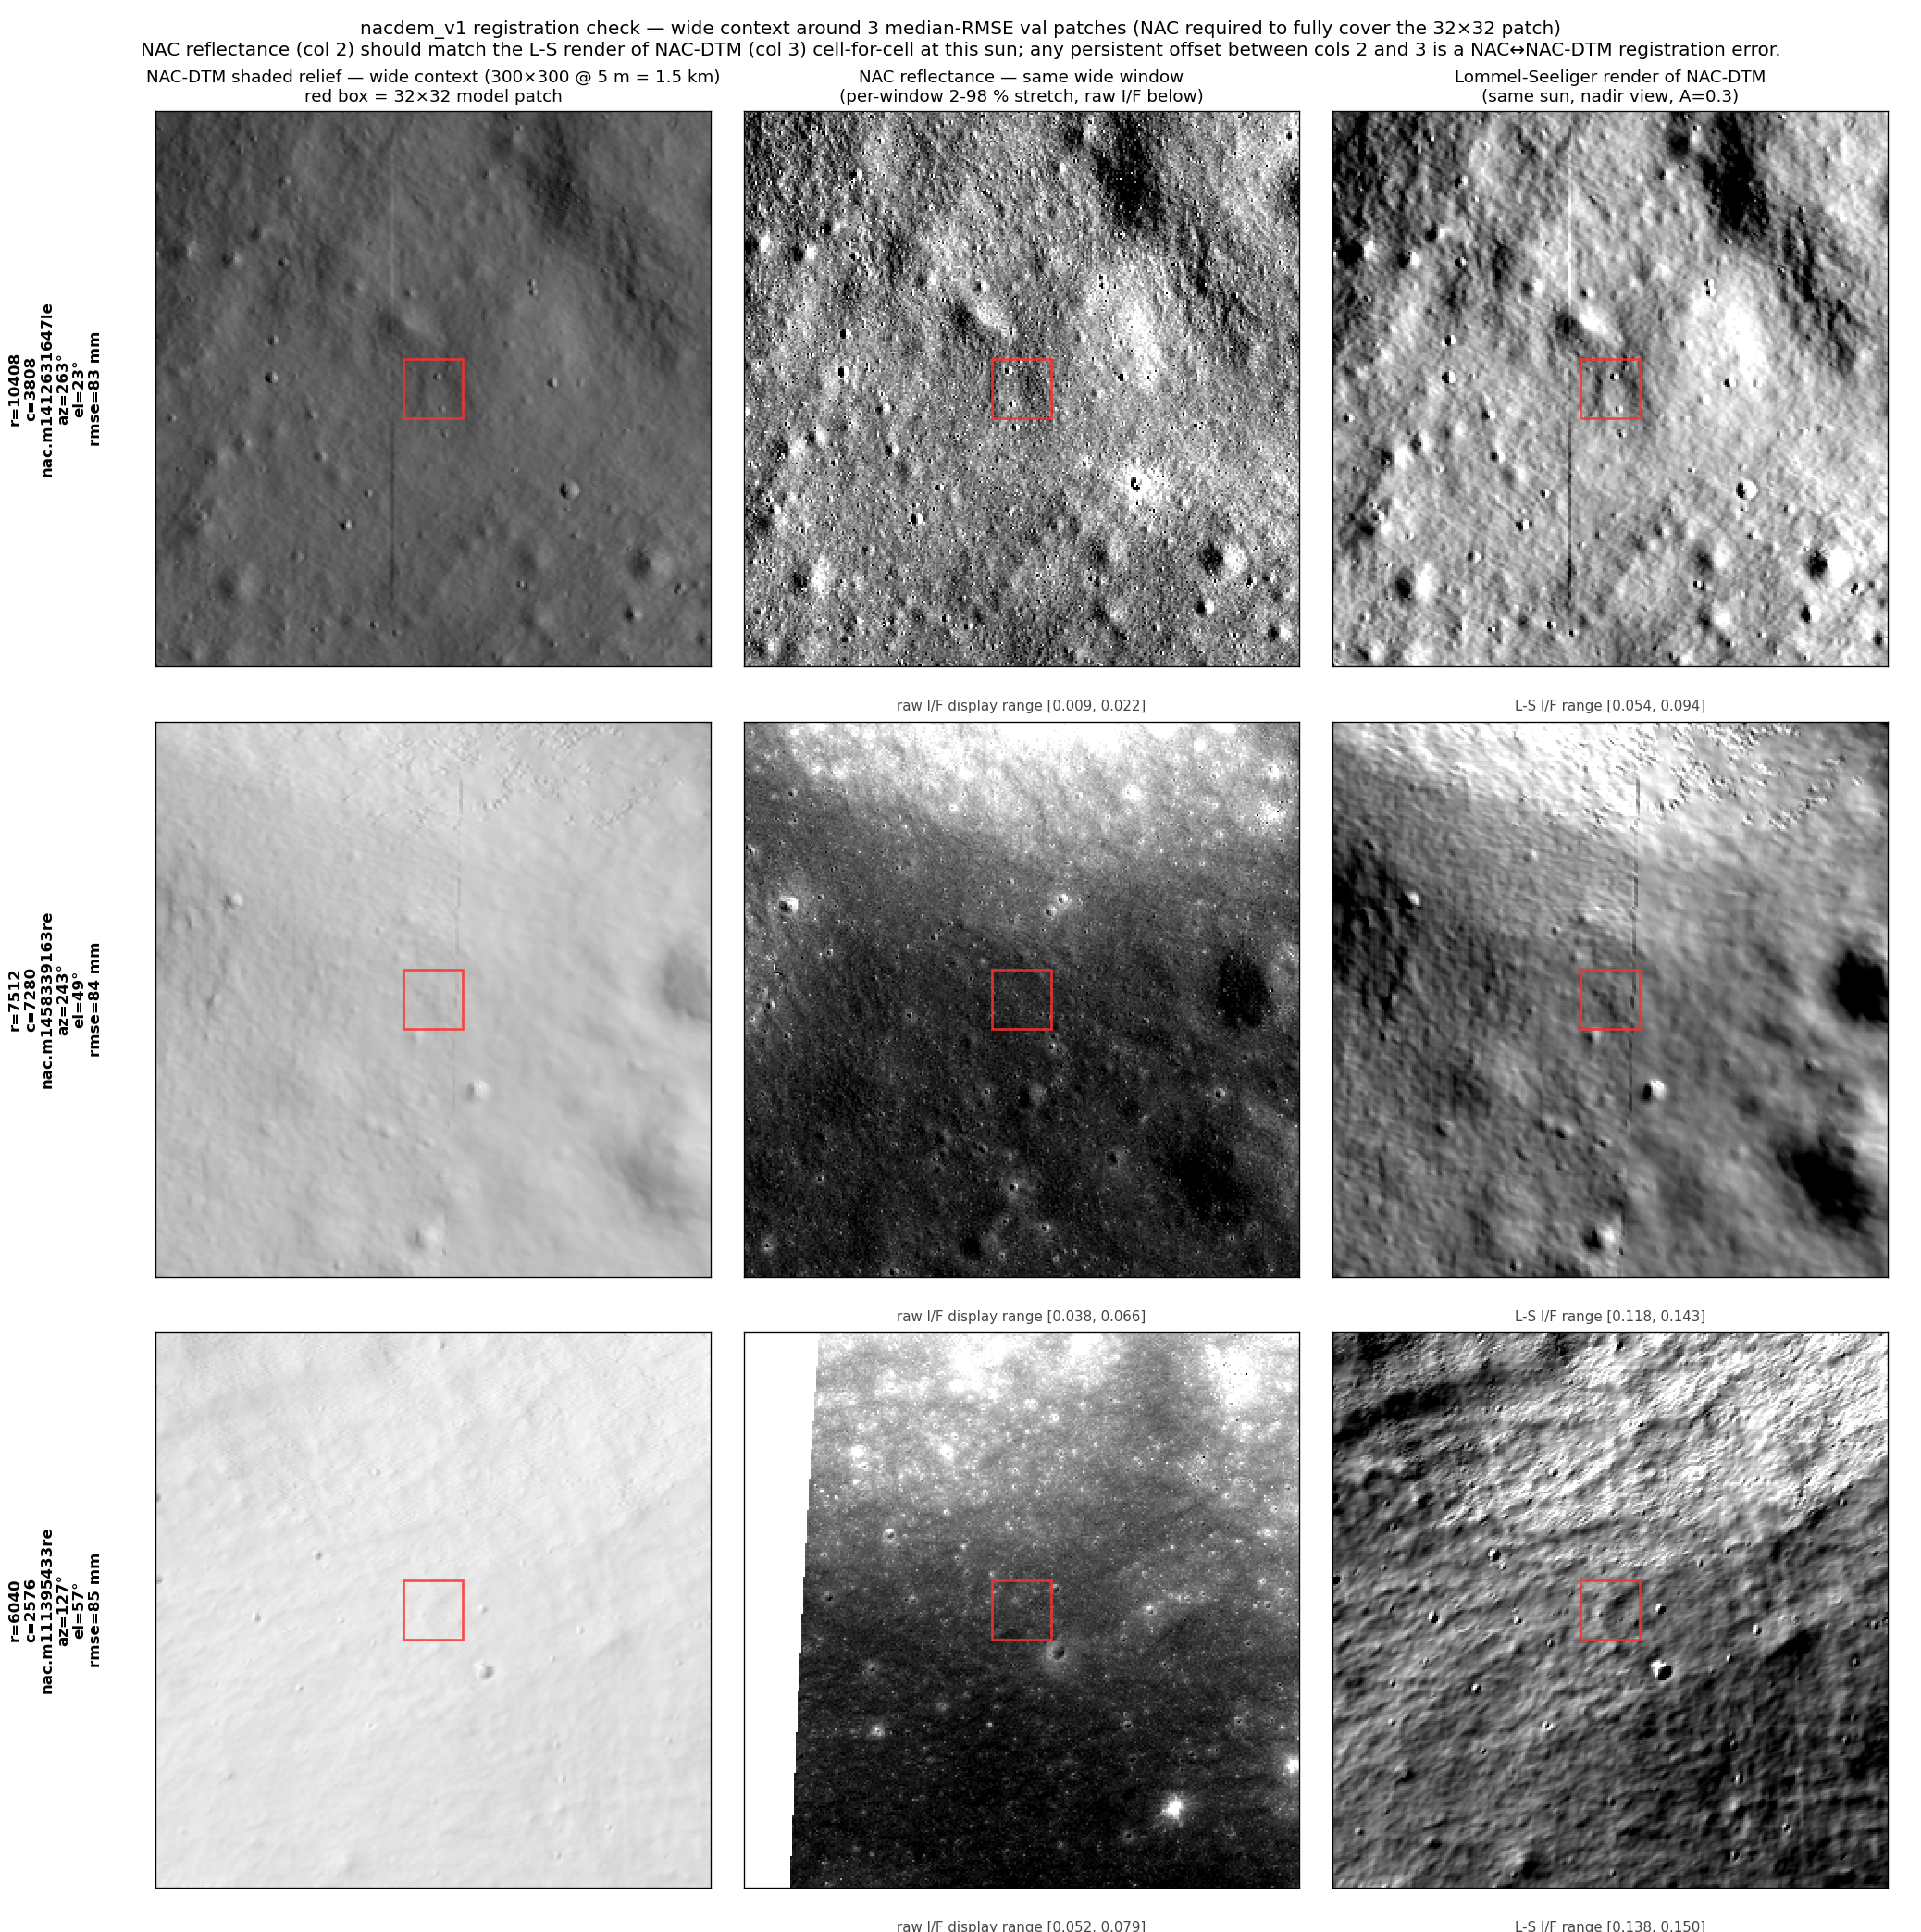
Direct evidence the NAC channel is contributing in v12 — and a new "is L-S a fair proxy for NAC?" diagnostic. Two new dashboard cards pair with v12 and v15low's best/worst/median: nacdem_v{12,15low}_best_worst_median_with_ls.png add a fourth column that renders a Lommel-Seeliger image of the same NAC-DTM patch under that NAC's sun, displayed on the SAME 2–98 % stretch as the NAC column so the side-by-side compare is honest. Per-patch (NAC-mean, L-S-mean, NAC-vs-L-S Pearson corr) printed underneath. v12: best +0.47, median +0.45, worst +0.11. v15low: +0.21, +0.37, +0.11. A separate diagnostic nacdem_v12_vs_v13_residual_correlation.png computes per-patch Pearson corr(pred residual, true residual) over 512 val patches for the v12 (NAC+sun) and v13 (zero-NAC control) models — v12 median +0.181 vs v13 median +0.022, gap +0.160; v12 has 70 % of patches with corr>0.1 vs 31 % for v13 (and 26 % vs 2 % at >0.3). Verdict: NAC contributes meaningfully — the photometric channel is doing real work. Mars-vs-ours conceptual diff also reviewed (see report below).
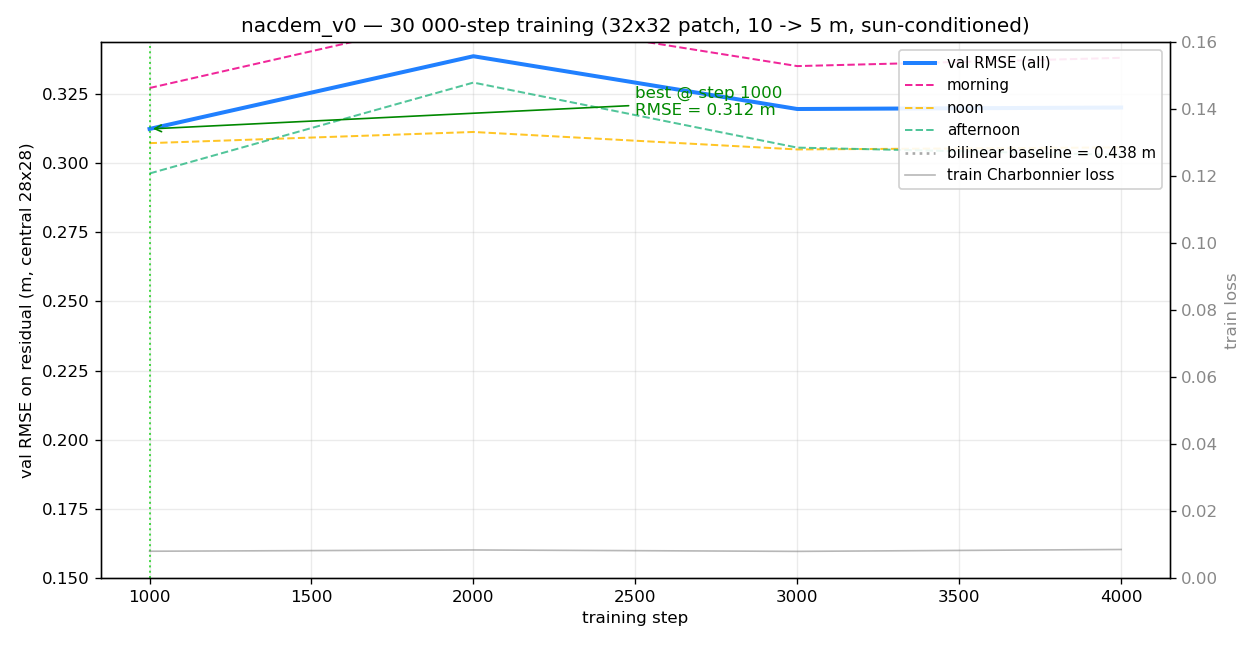
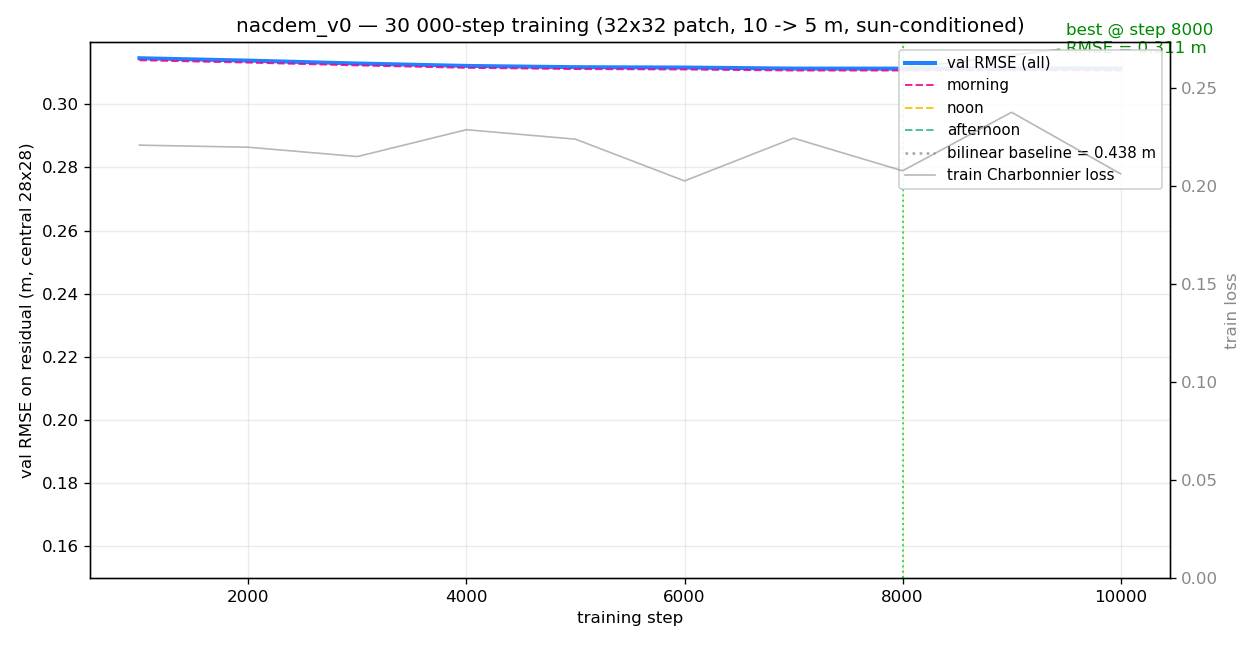
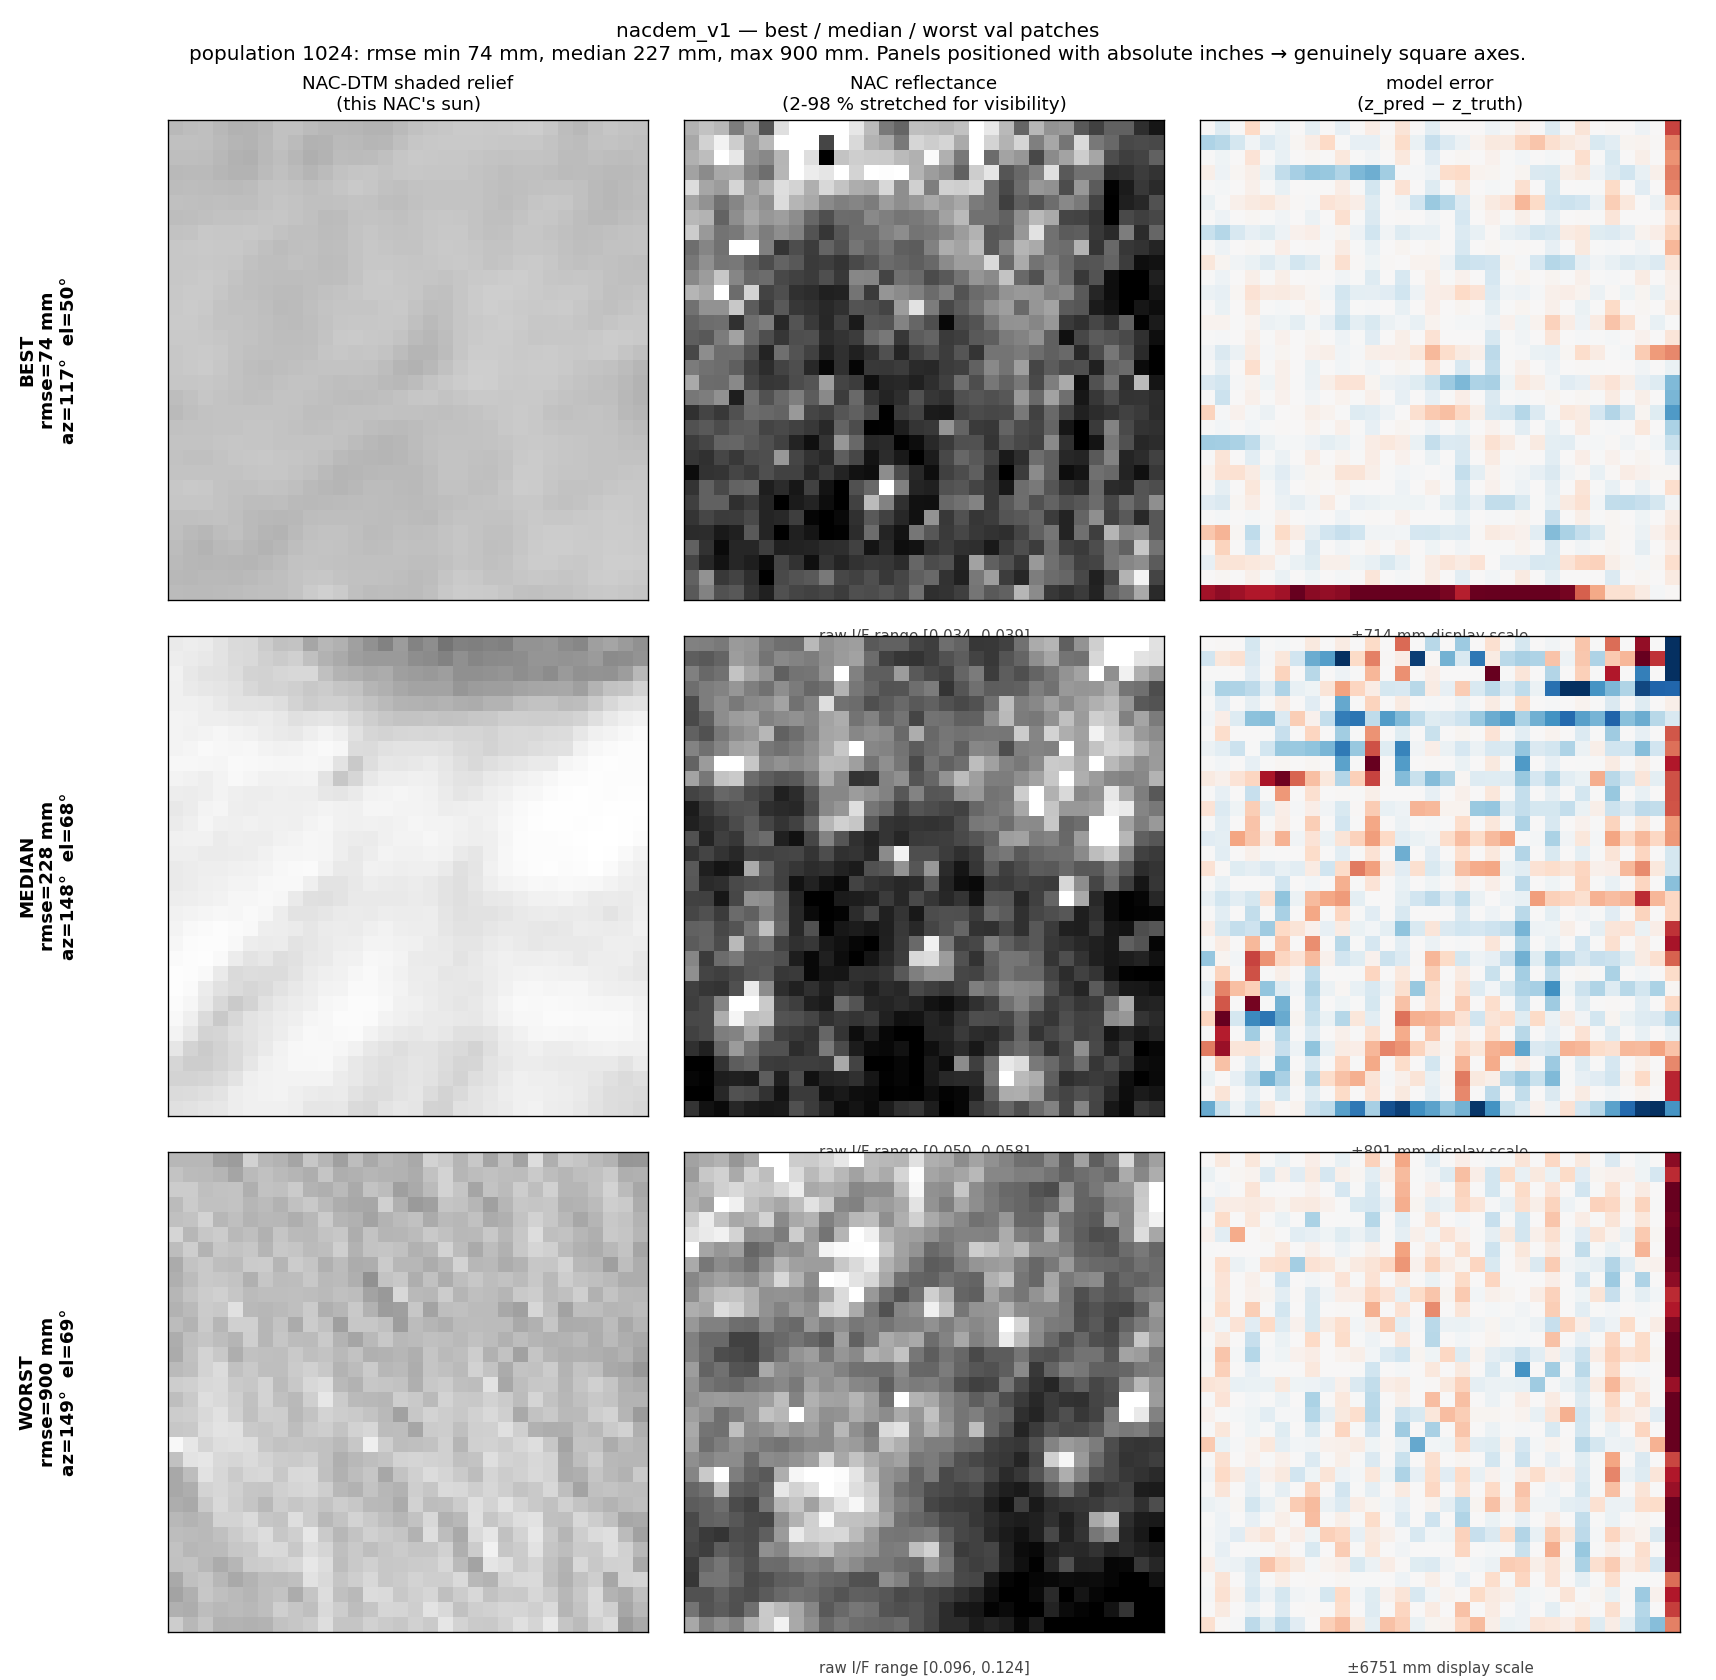
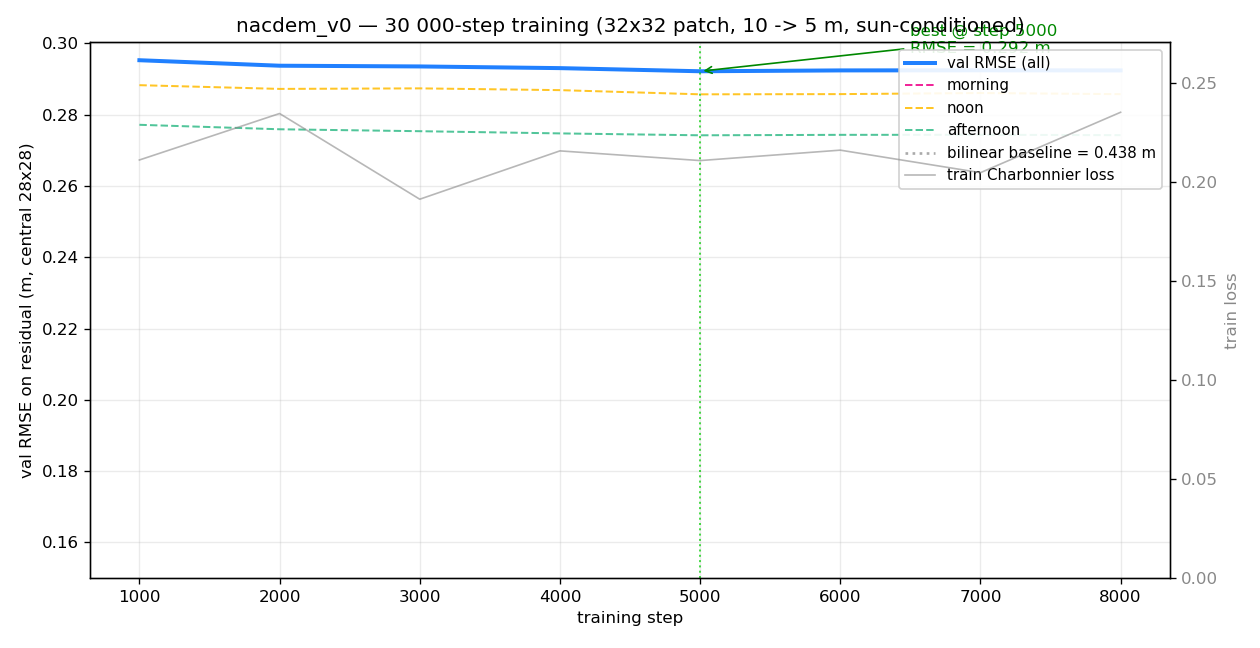
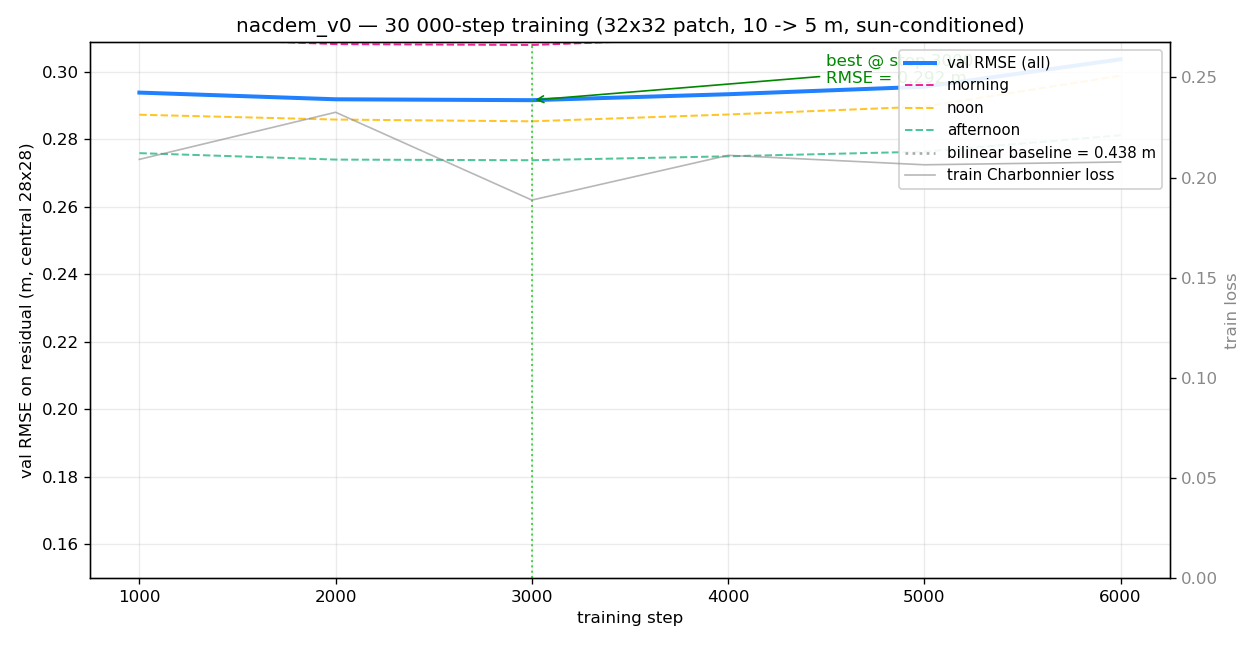
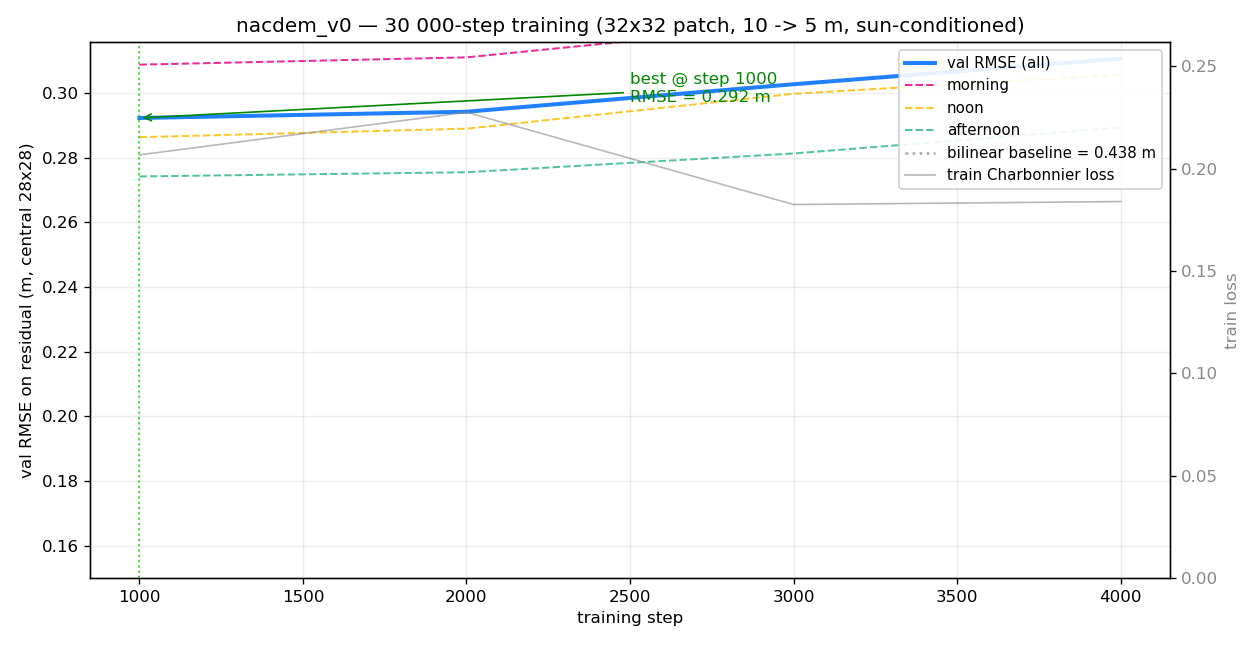
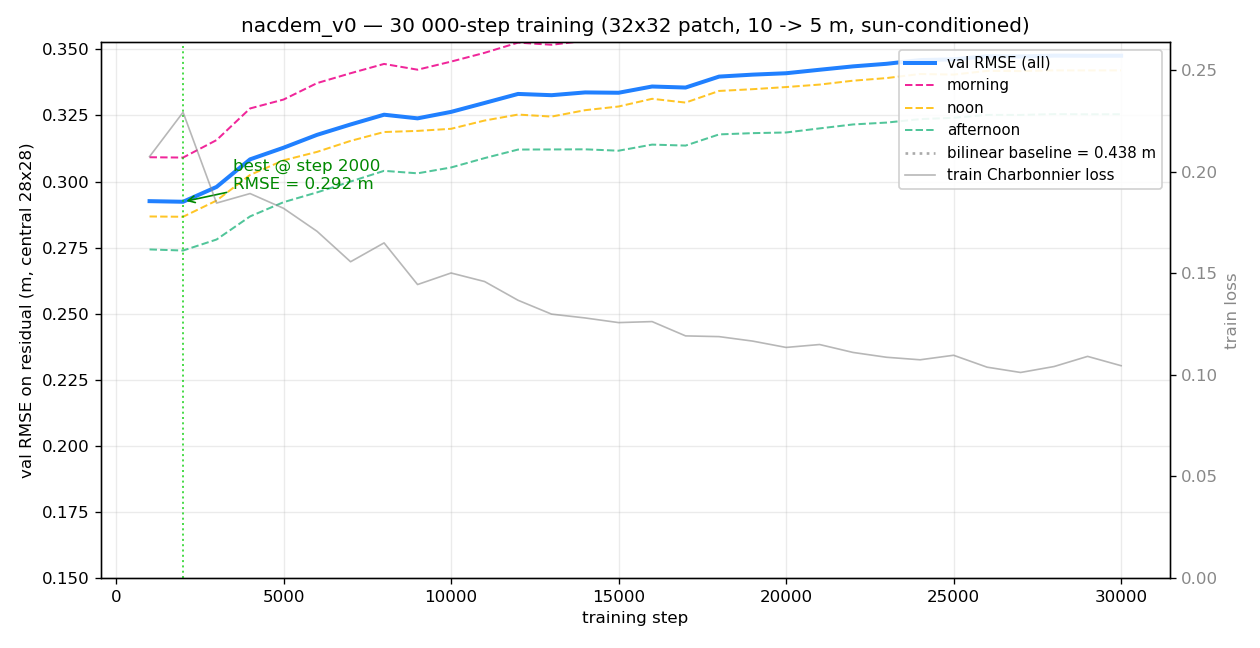
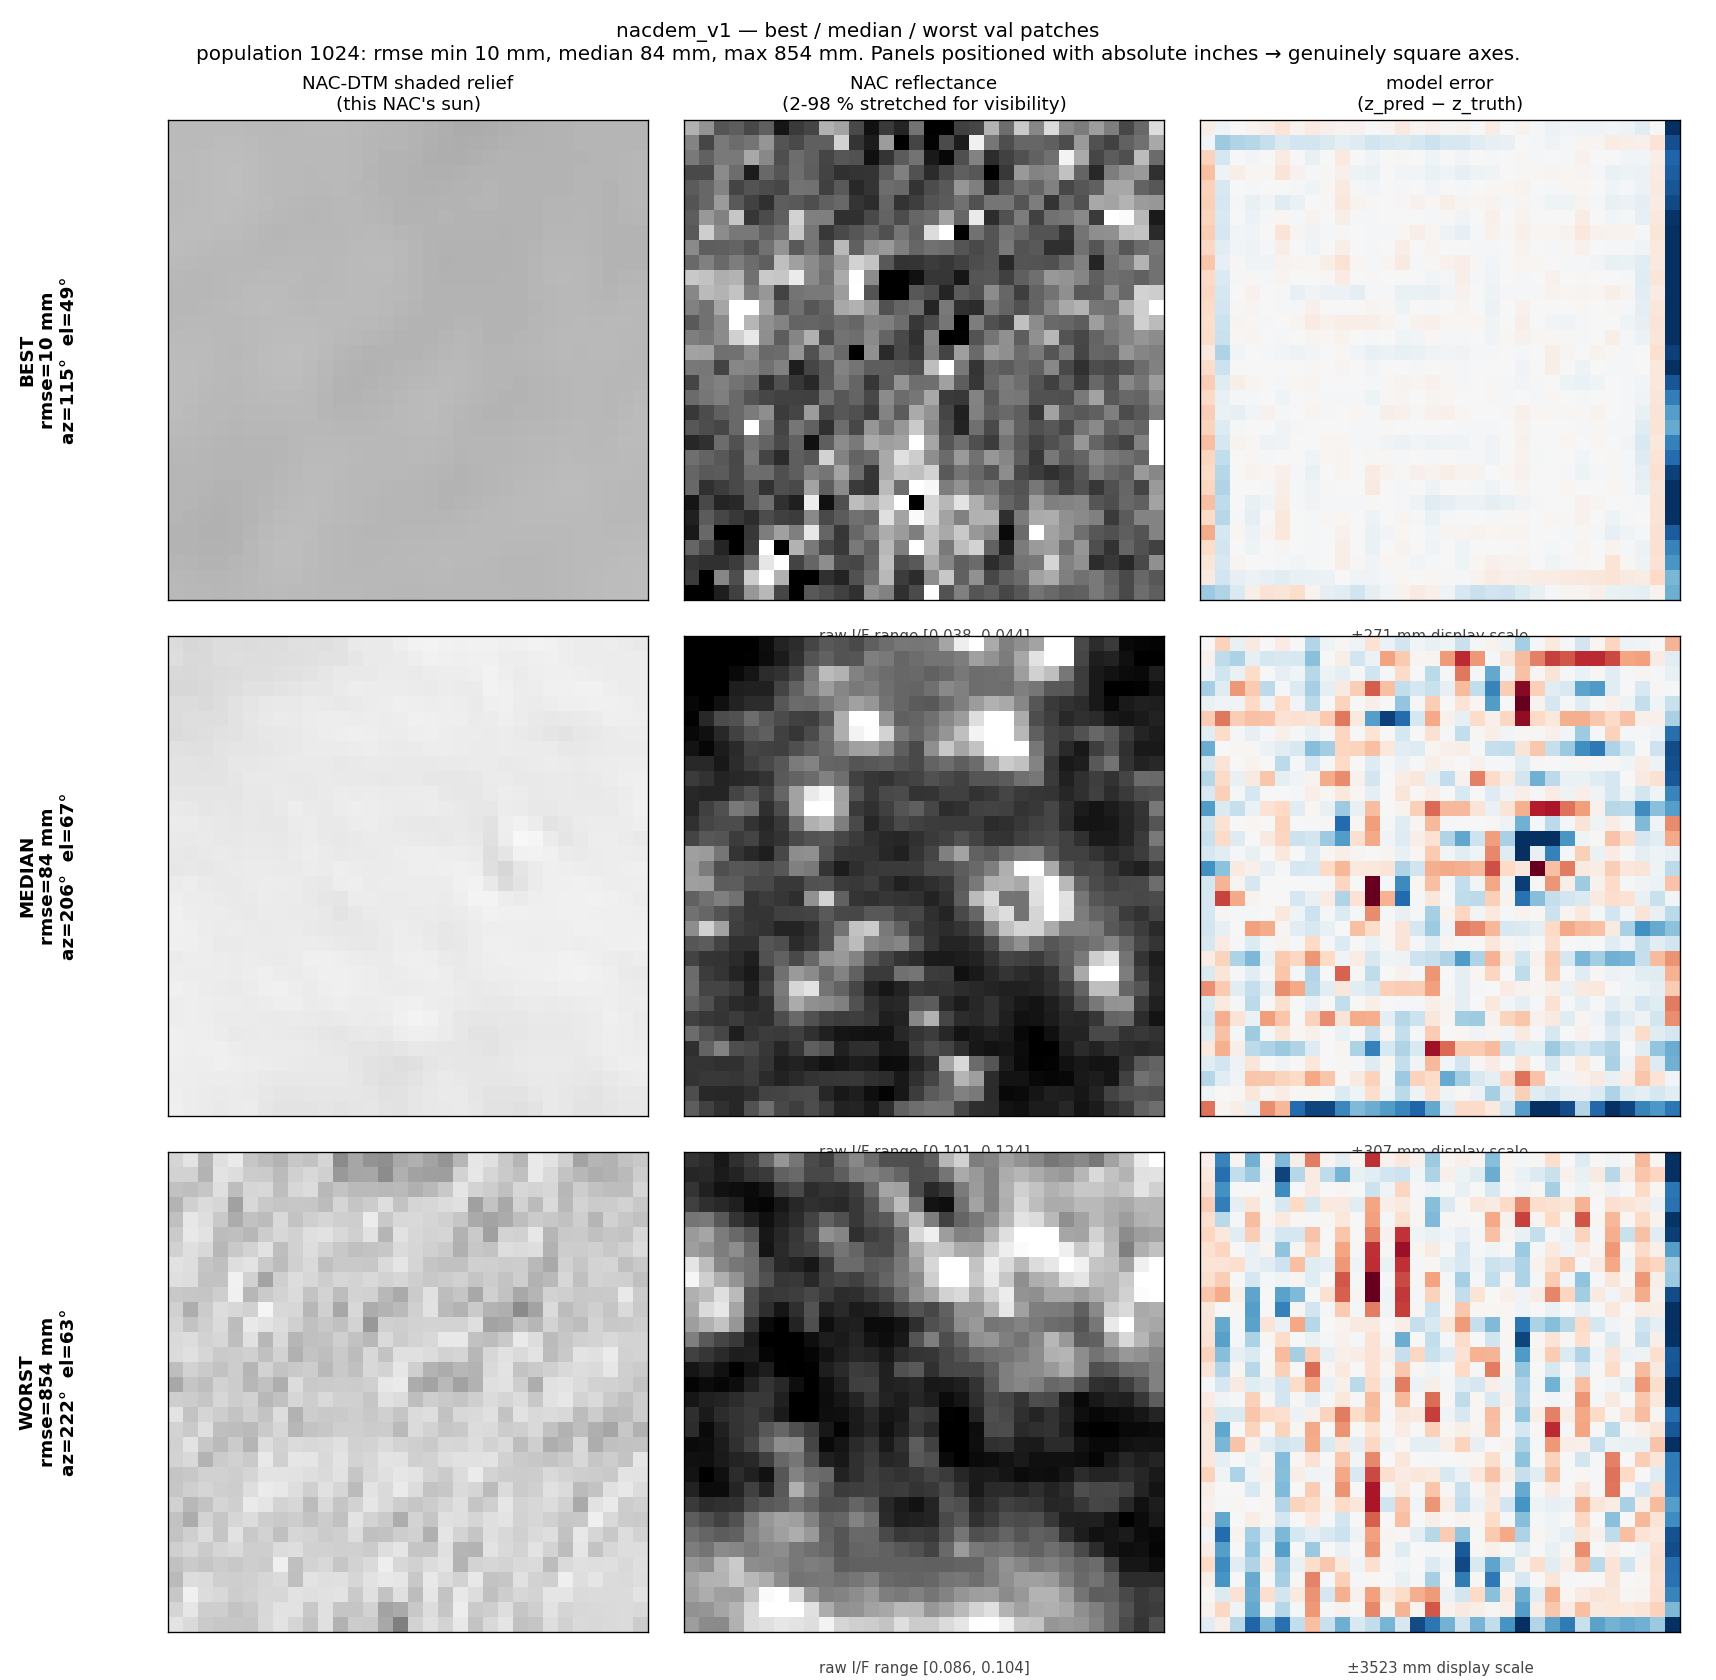
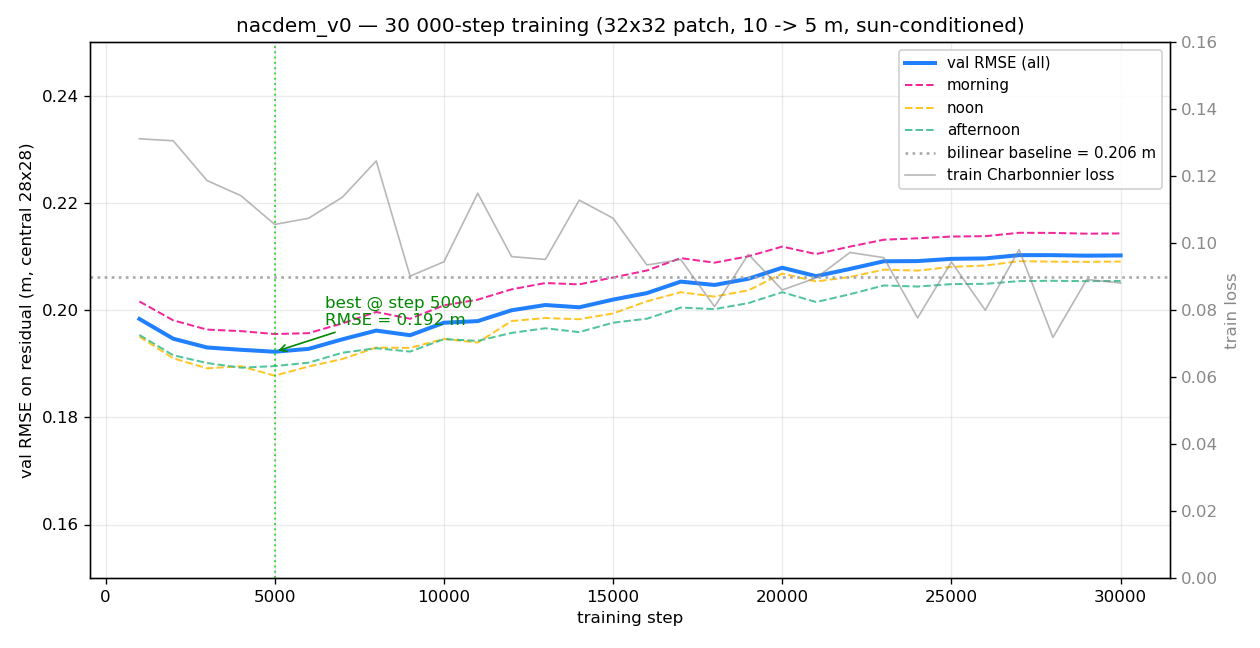
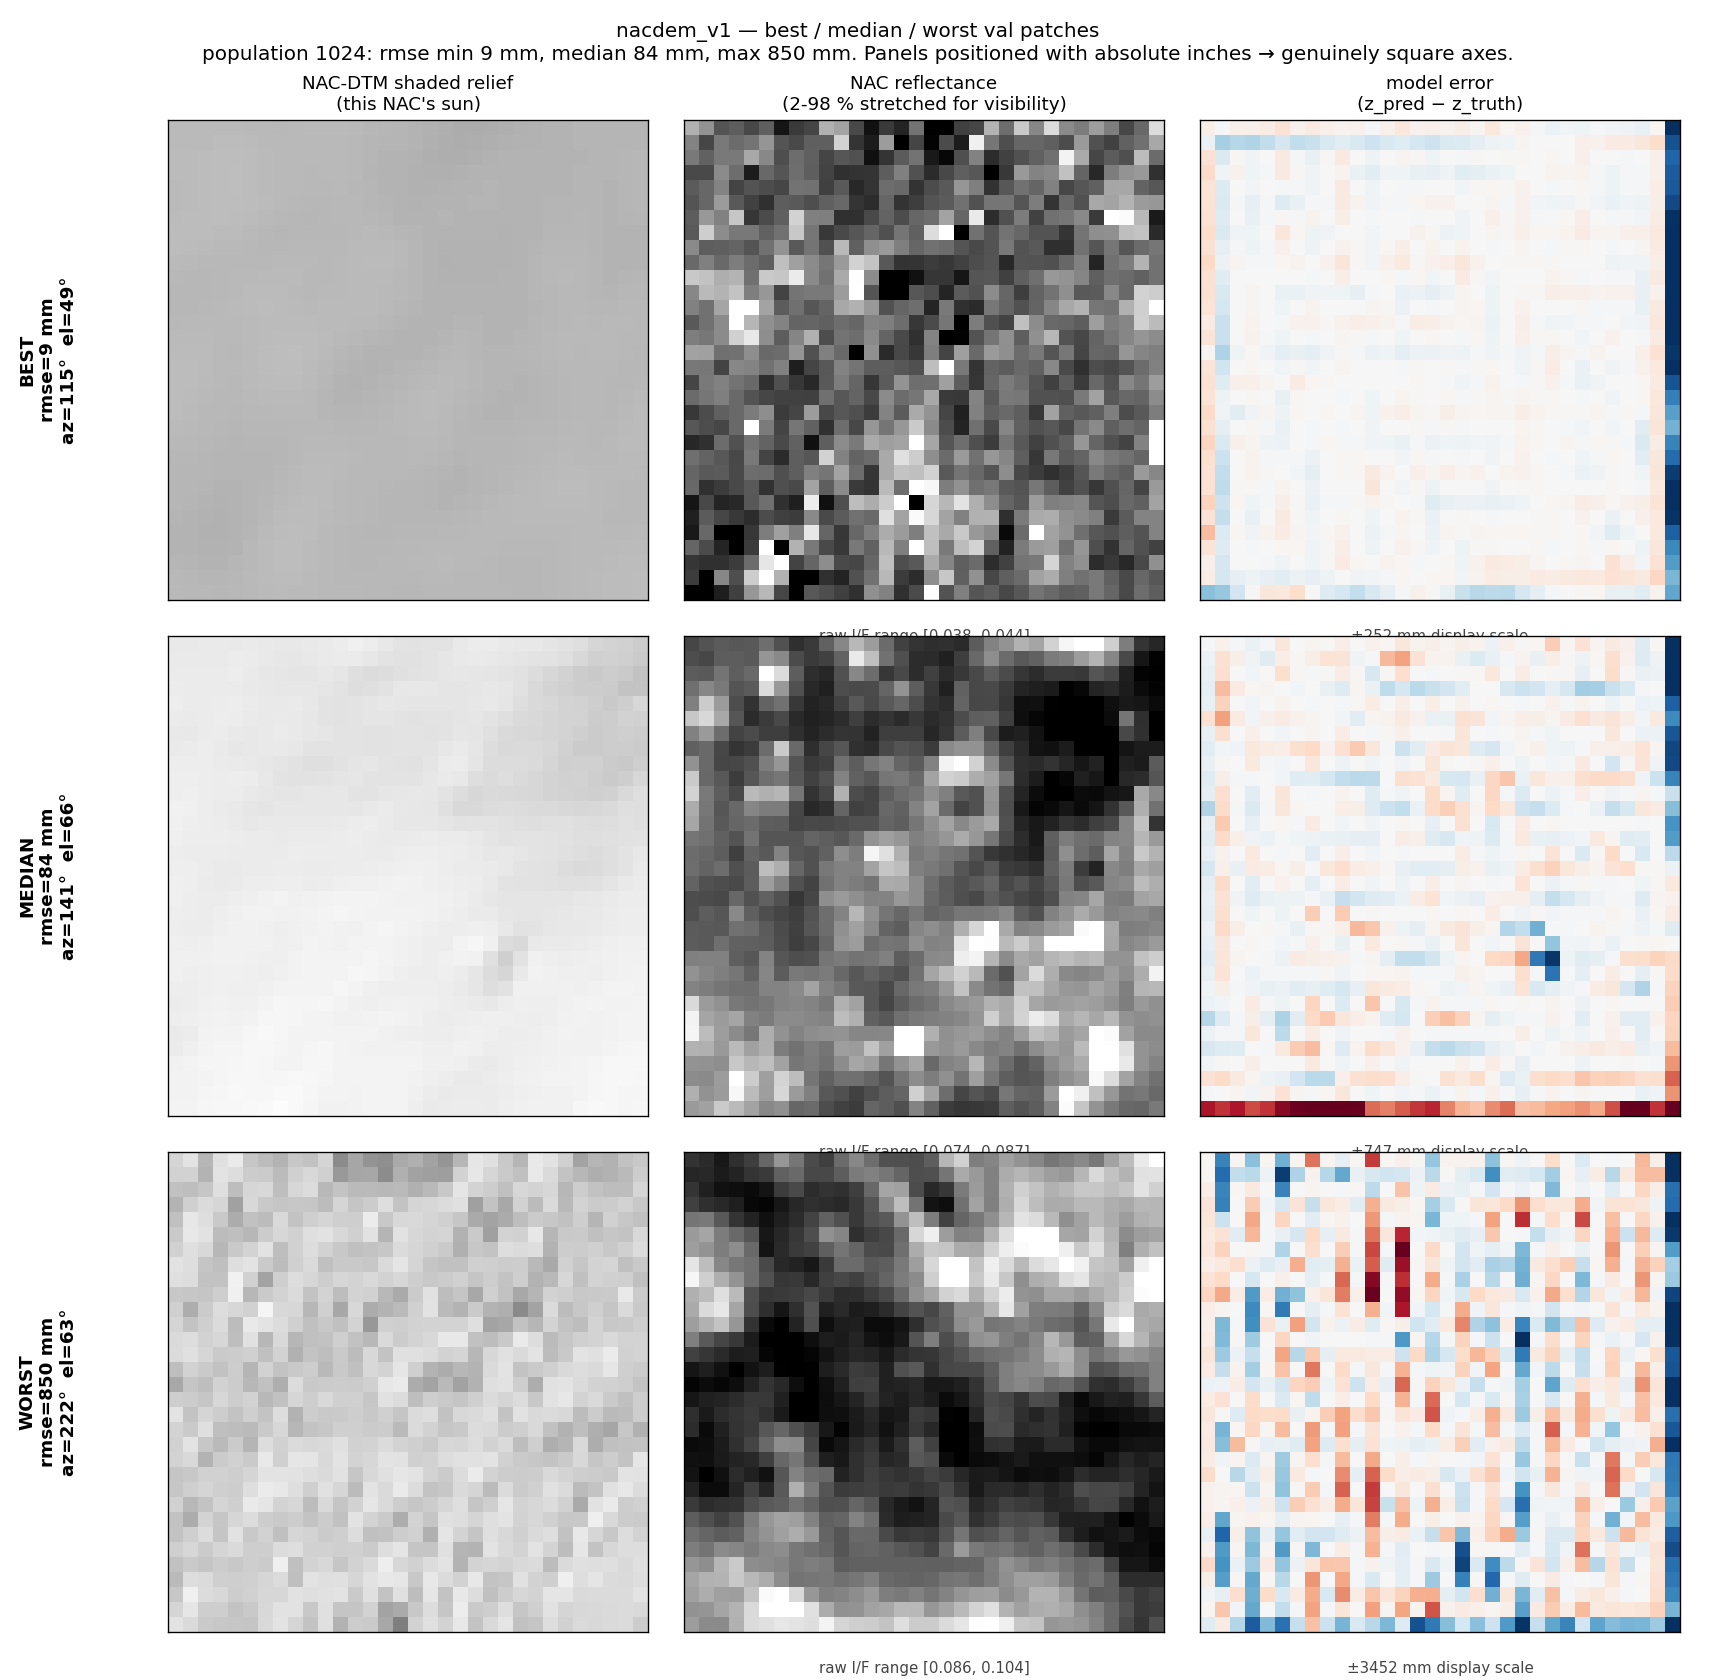
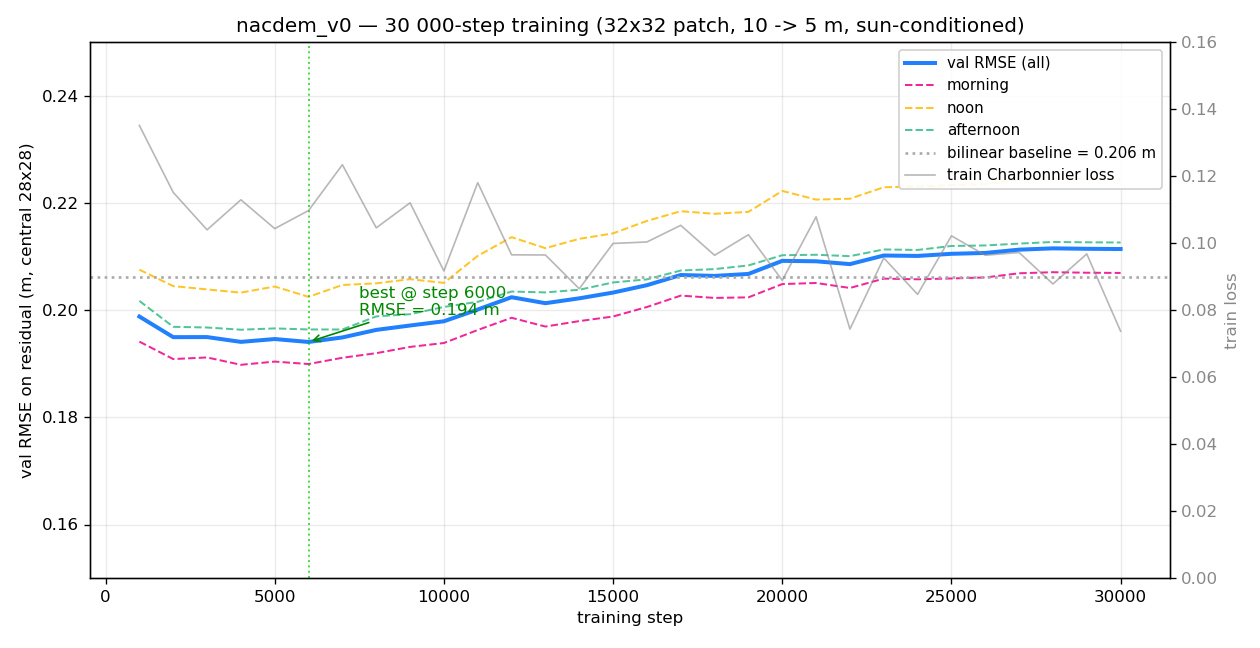
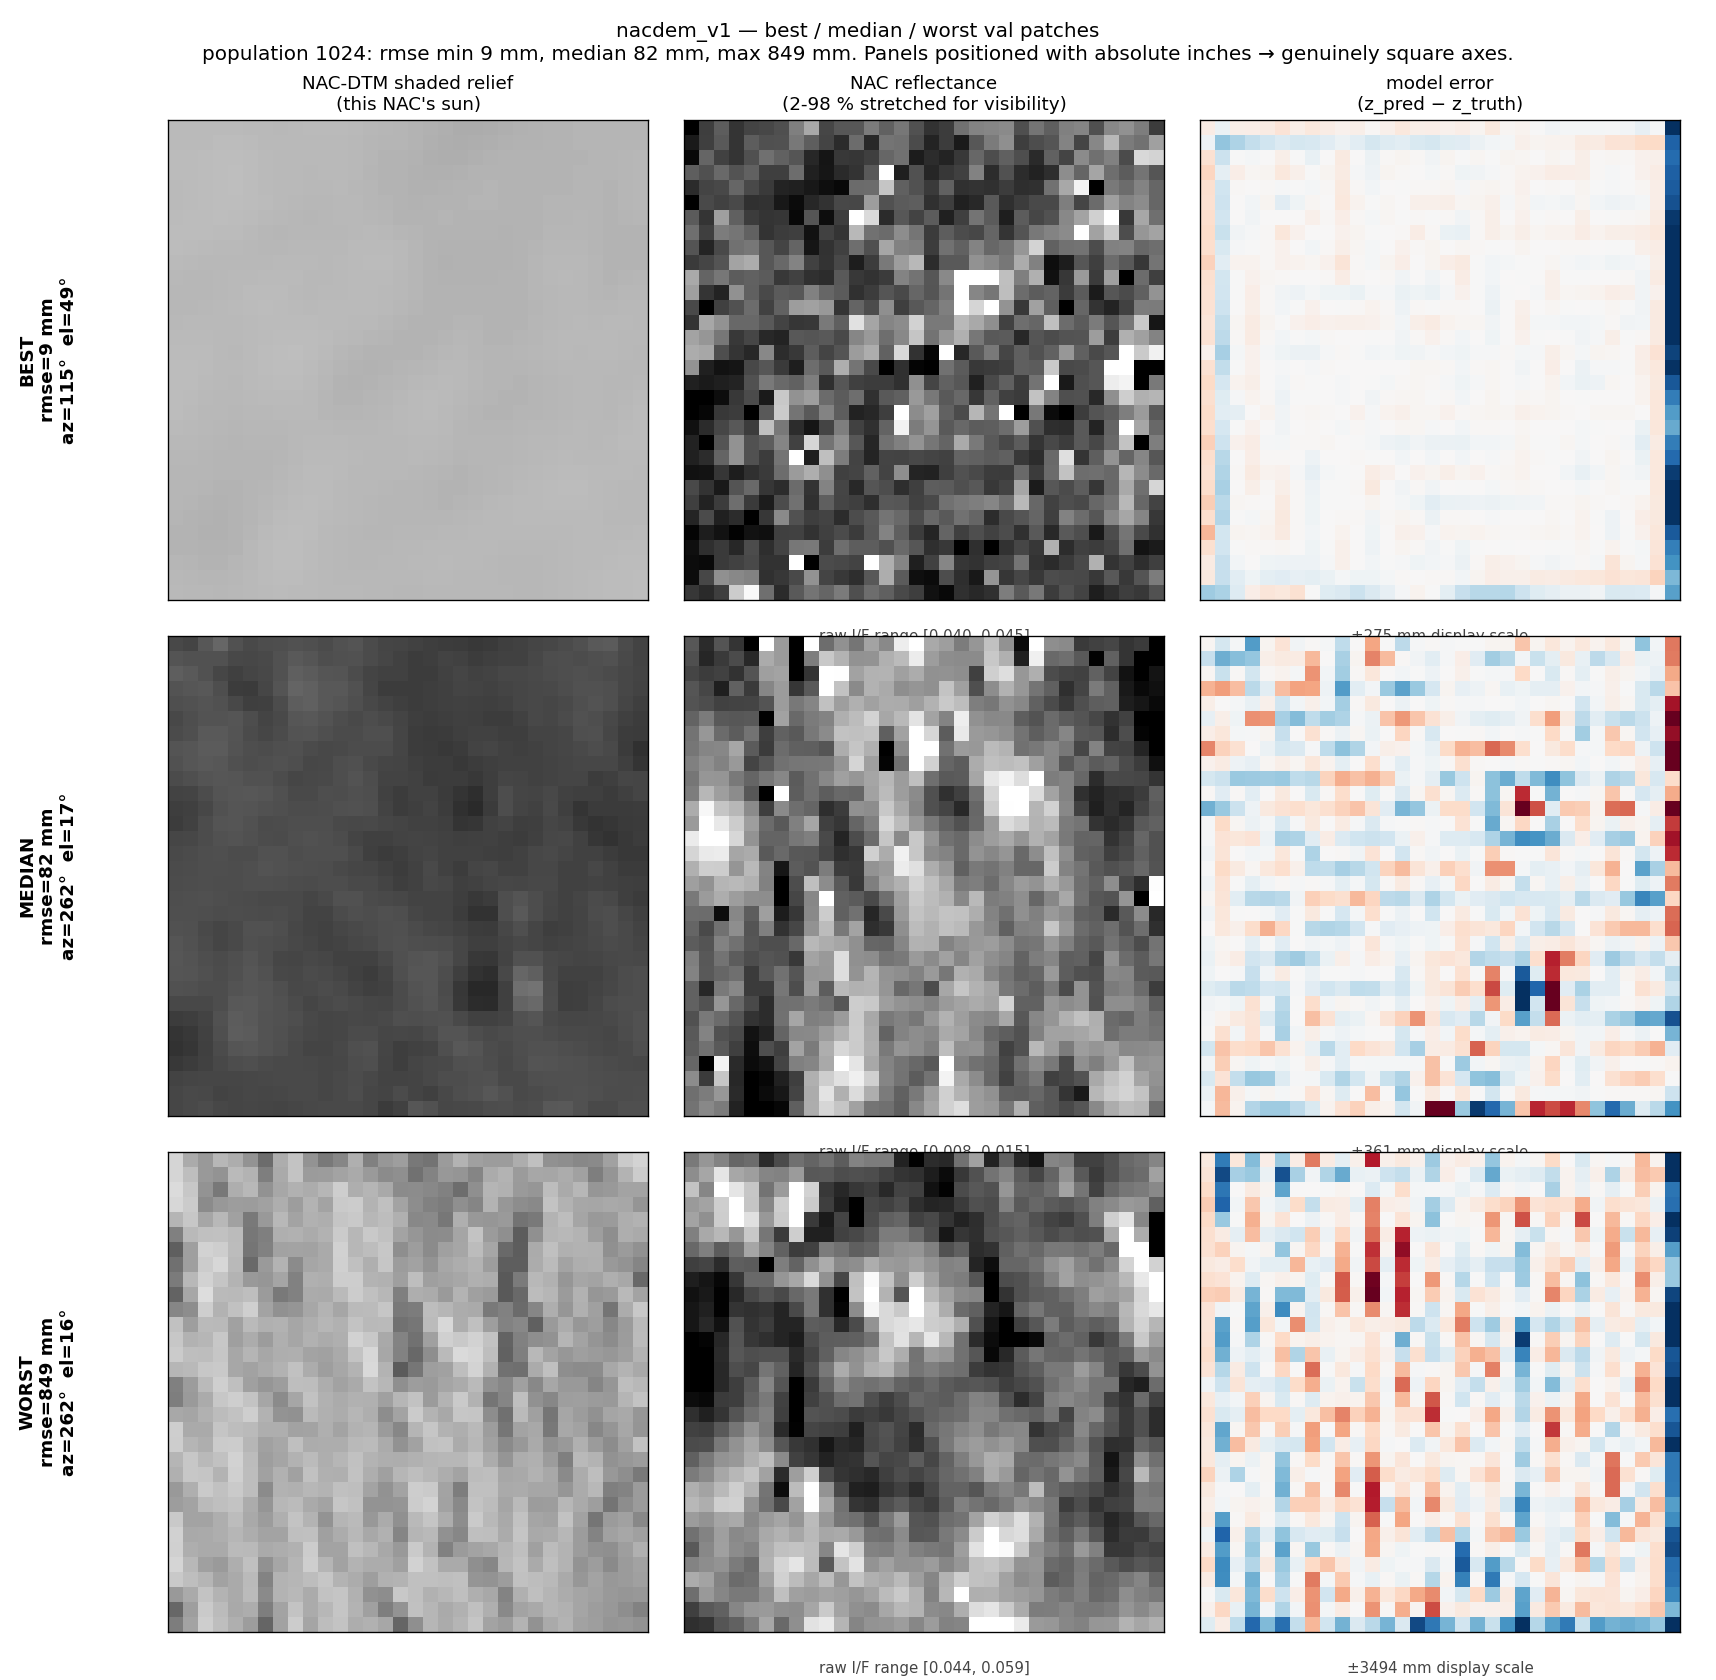
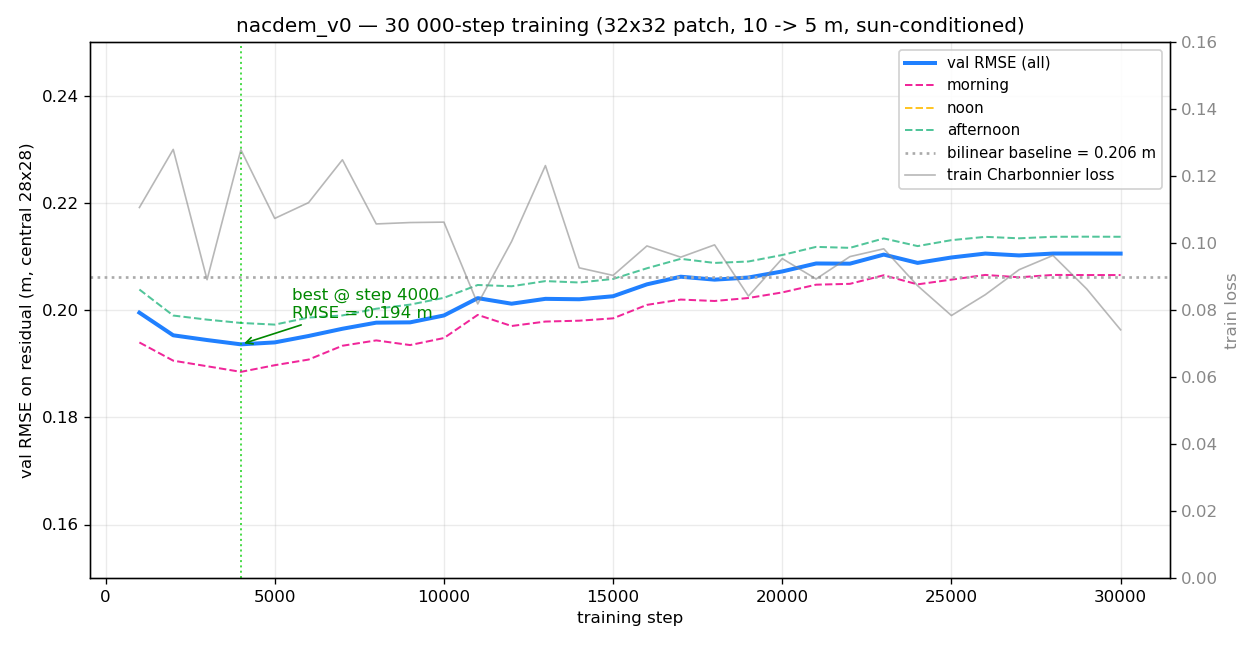
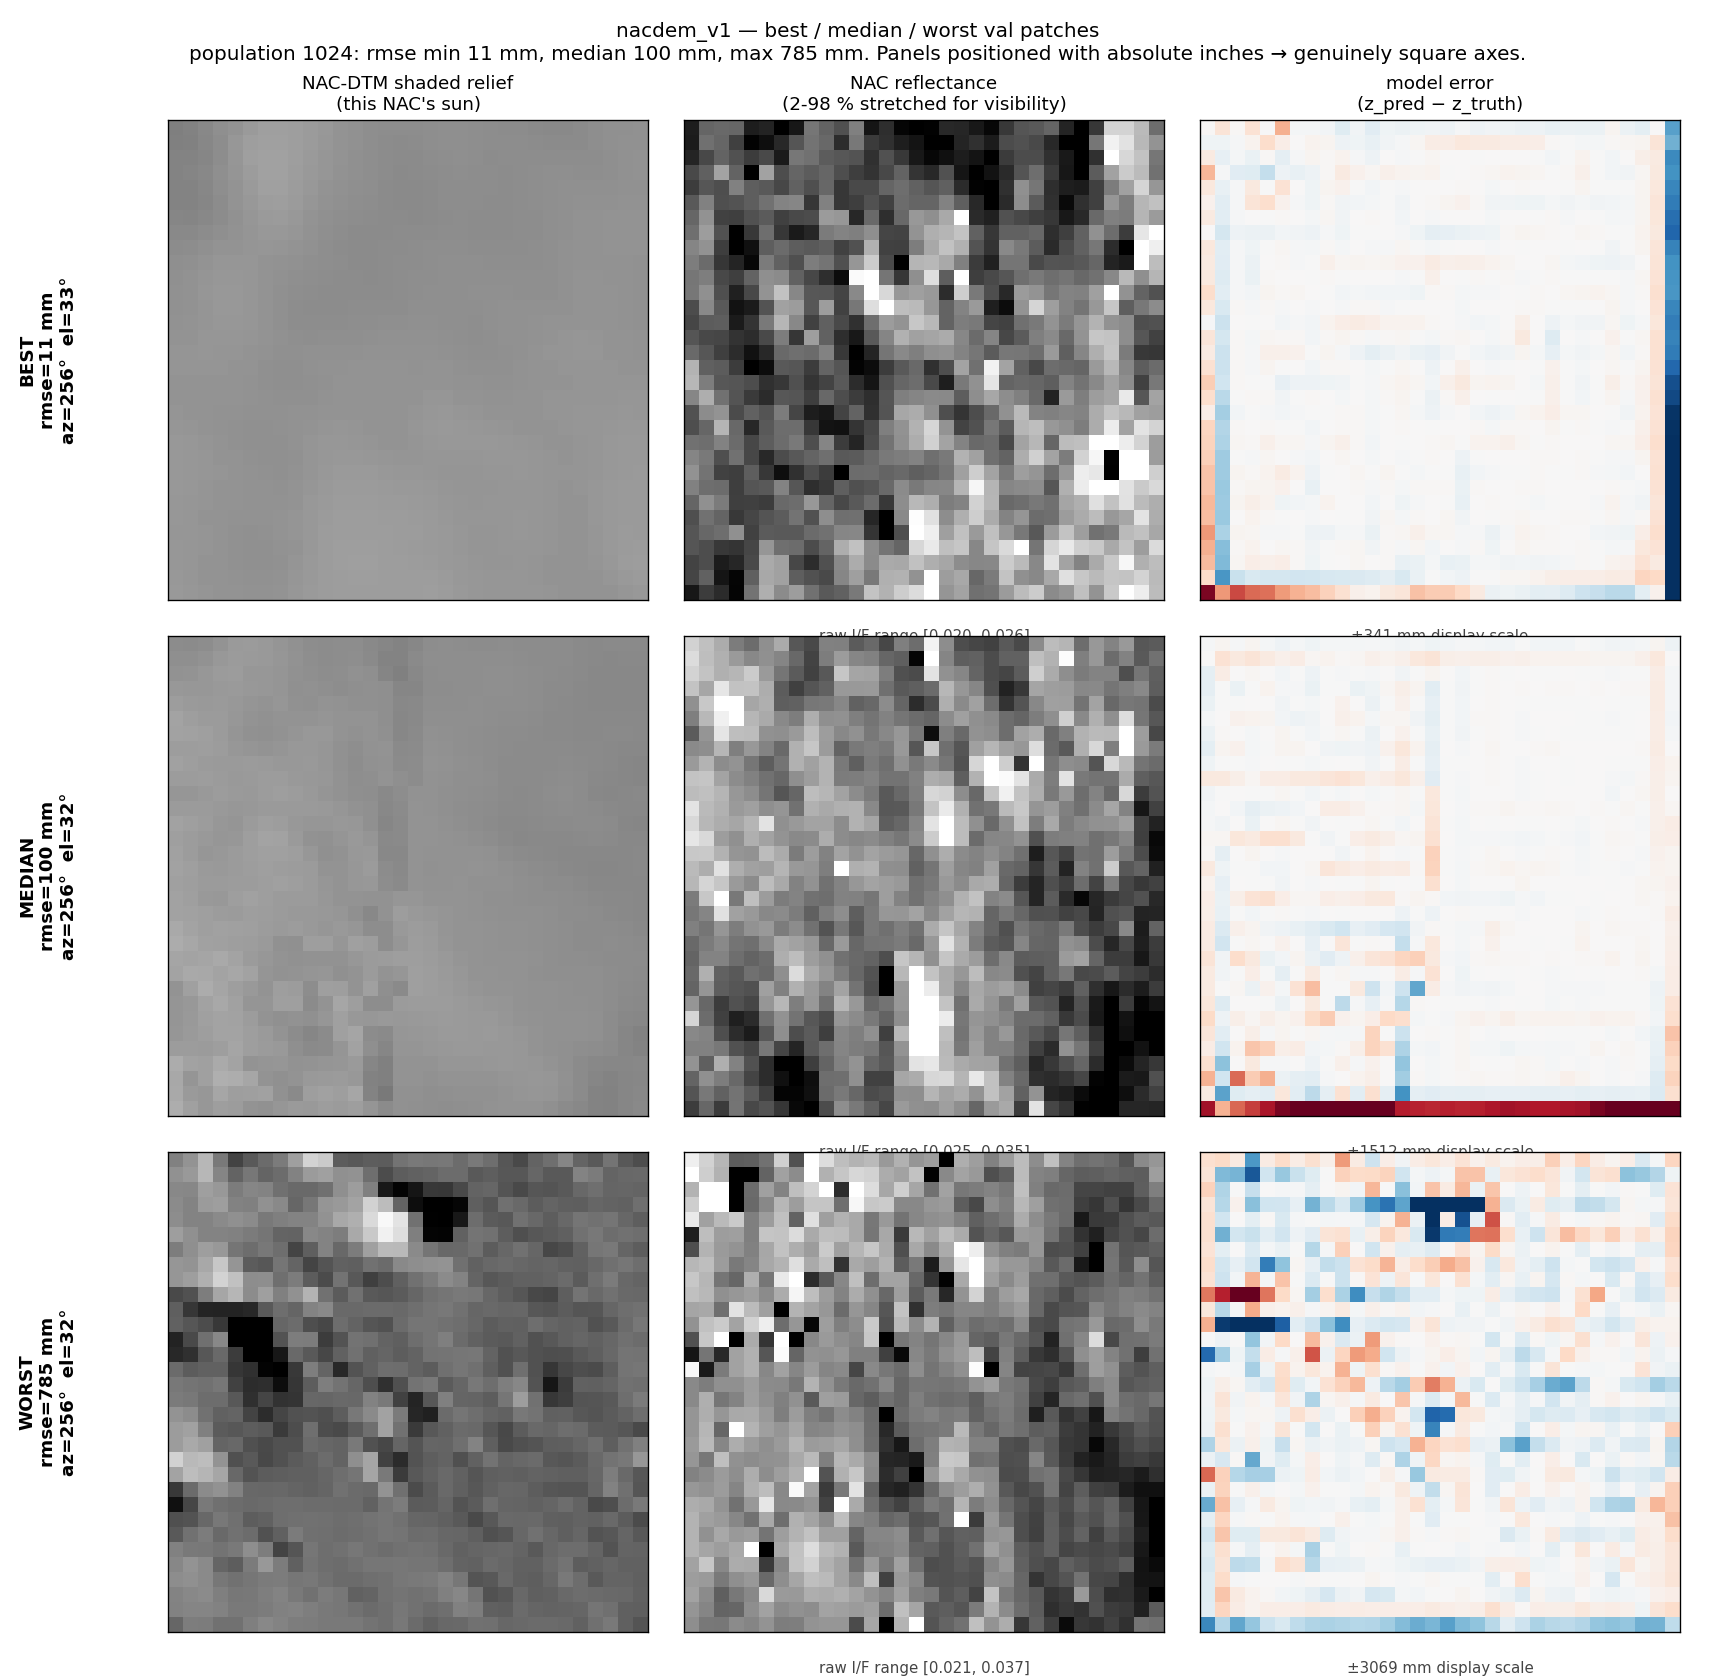
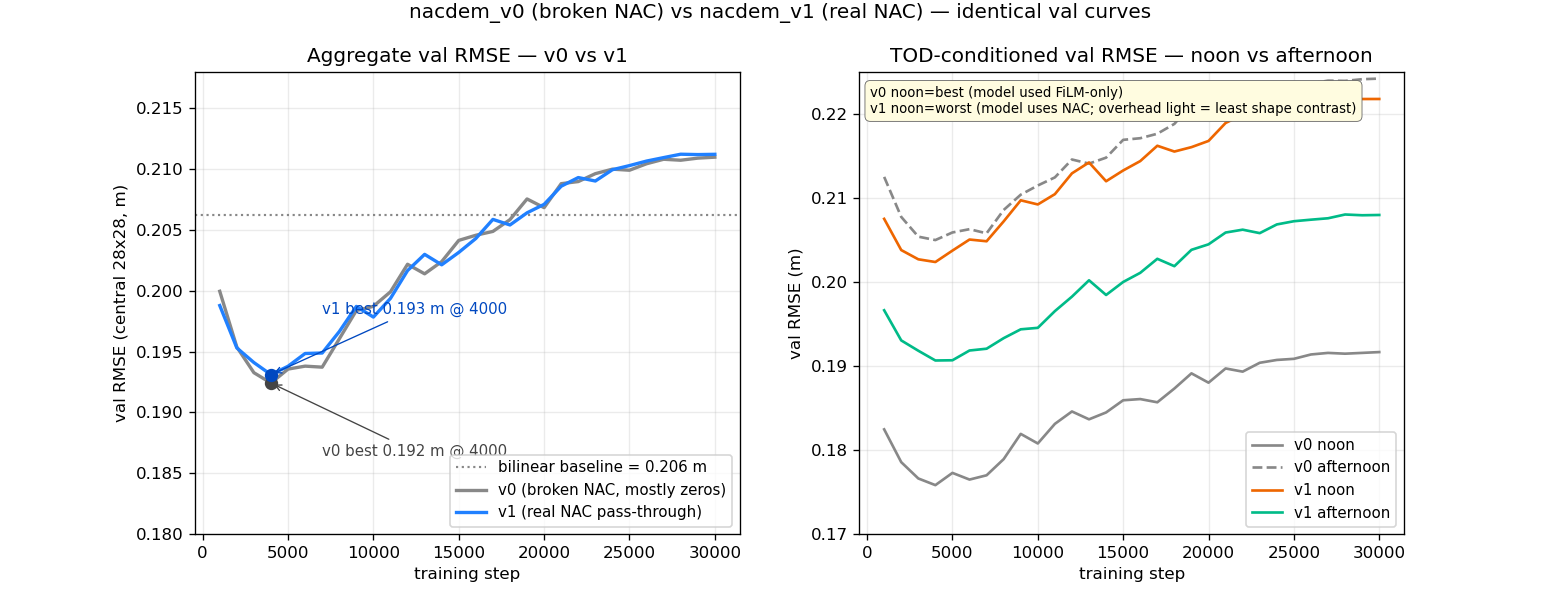
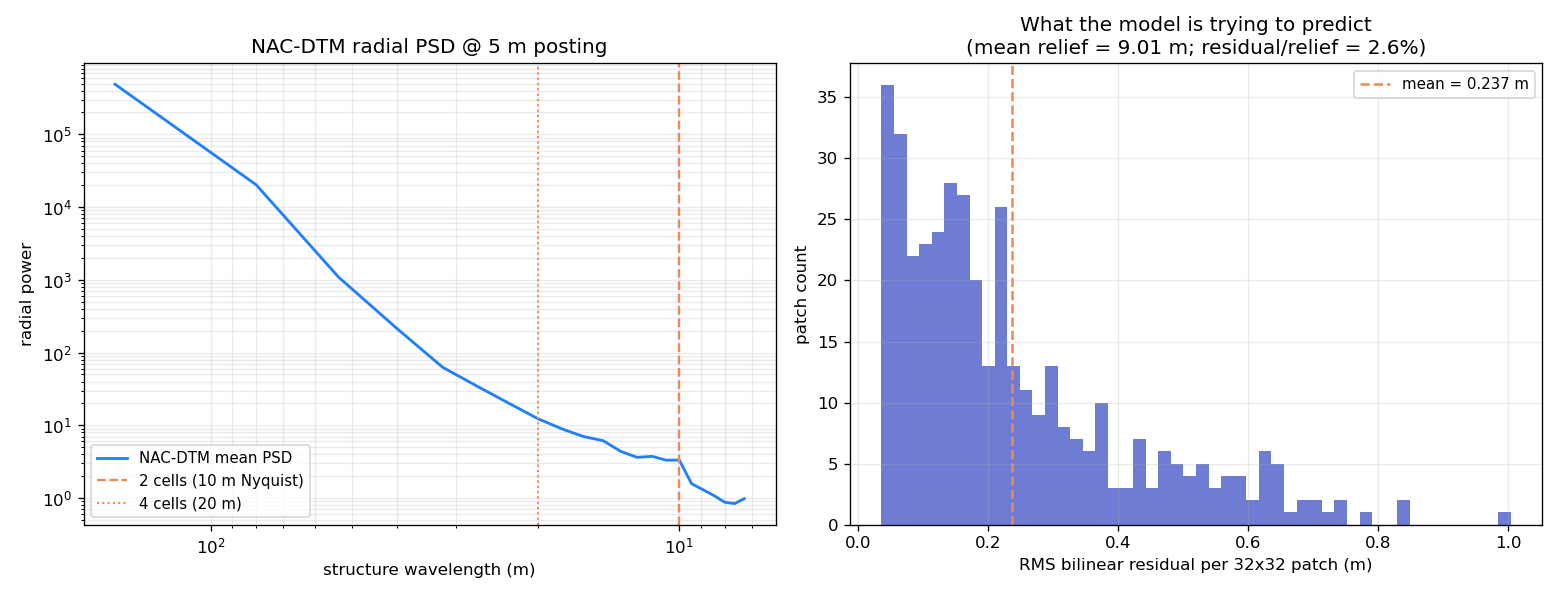
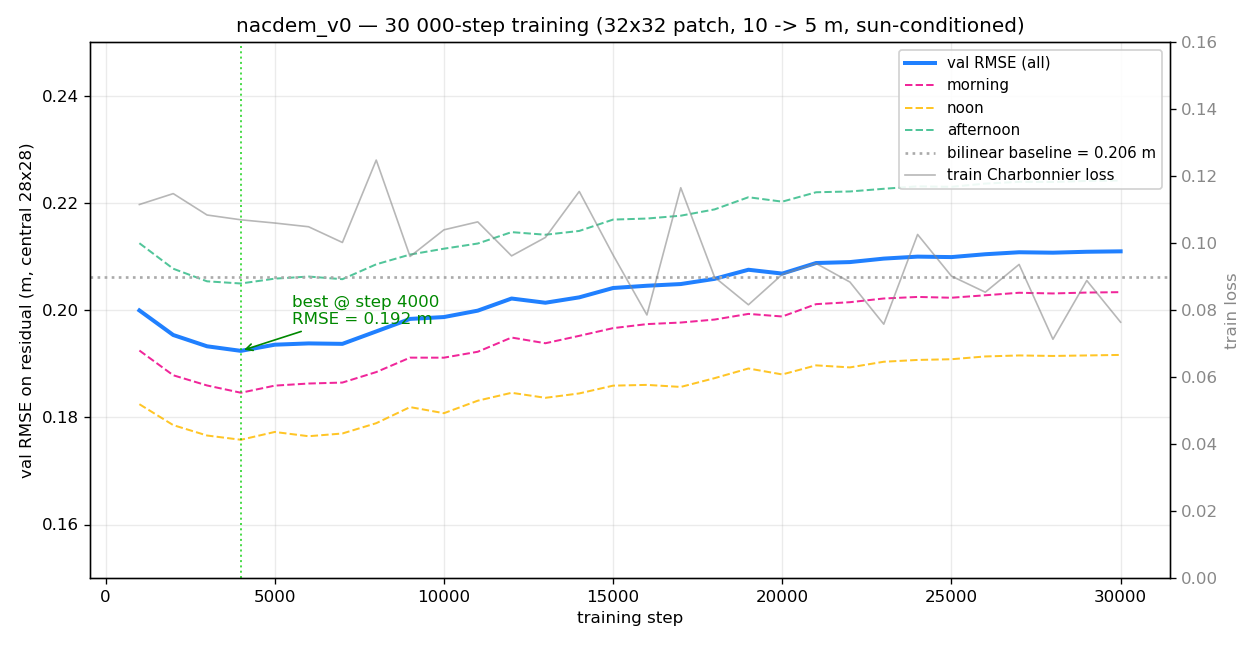
nacdem_v1 trained — fixing the NAC channel changed nothing. Same model, hyperparameters, data, seed; only the validity/normalization fix and the new coarse-coverage cache. Best val RMSE 0.193 m at step 4000 (v0: 0.192 m at step 4000). Δ best = −0.7 mm. Same overfit trajectory, same final val 0.211 m. The TOD pattern *reverses* (v0 noon=best, v1 noon=worst) — proof that the model is genuinely using the NAC photometry in v1, but the prediction target at 10 → 5 m has no recoverable signal regardless. Combined with the entropy result (per-patch bilinear residual = 2.6 % of relief), the conclusion is ironclad: this scale is bankrupt and no model/data change at 10 → 5 m will help. Next move must change the prediction task (coarser training scale, longer patch context, or different formulation), not the model architecture. Side fix: pre-computed coarse coverage cache (nac_coverage_coarse.npz, 30 MB) speeds up the now-honest dataloader from 0.8 → 12.2 batch/s; comparison card on the dashboard.
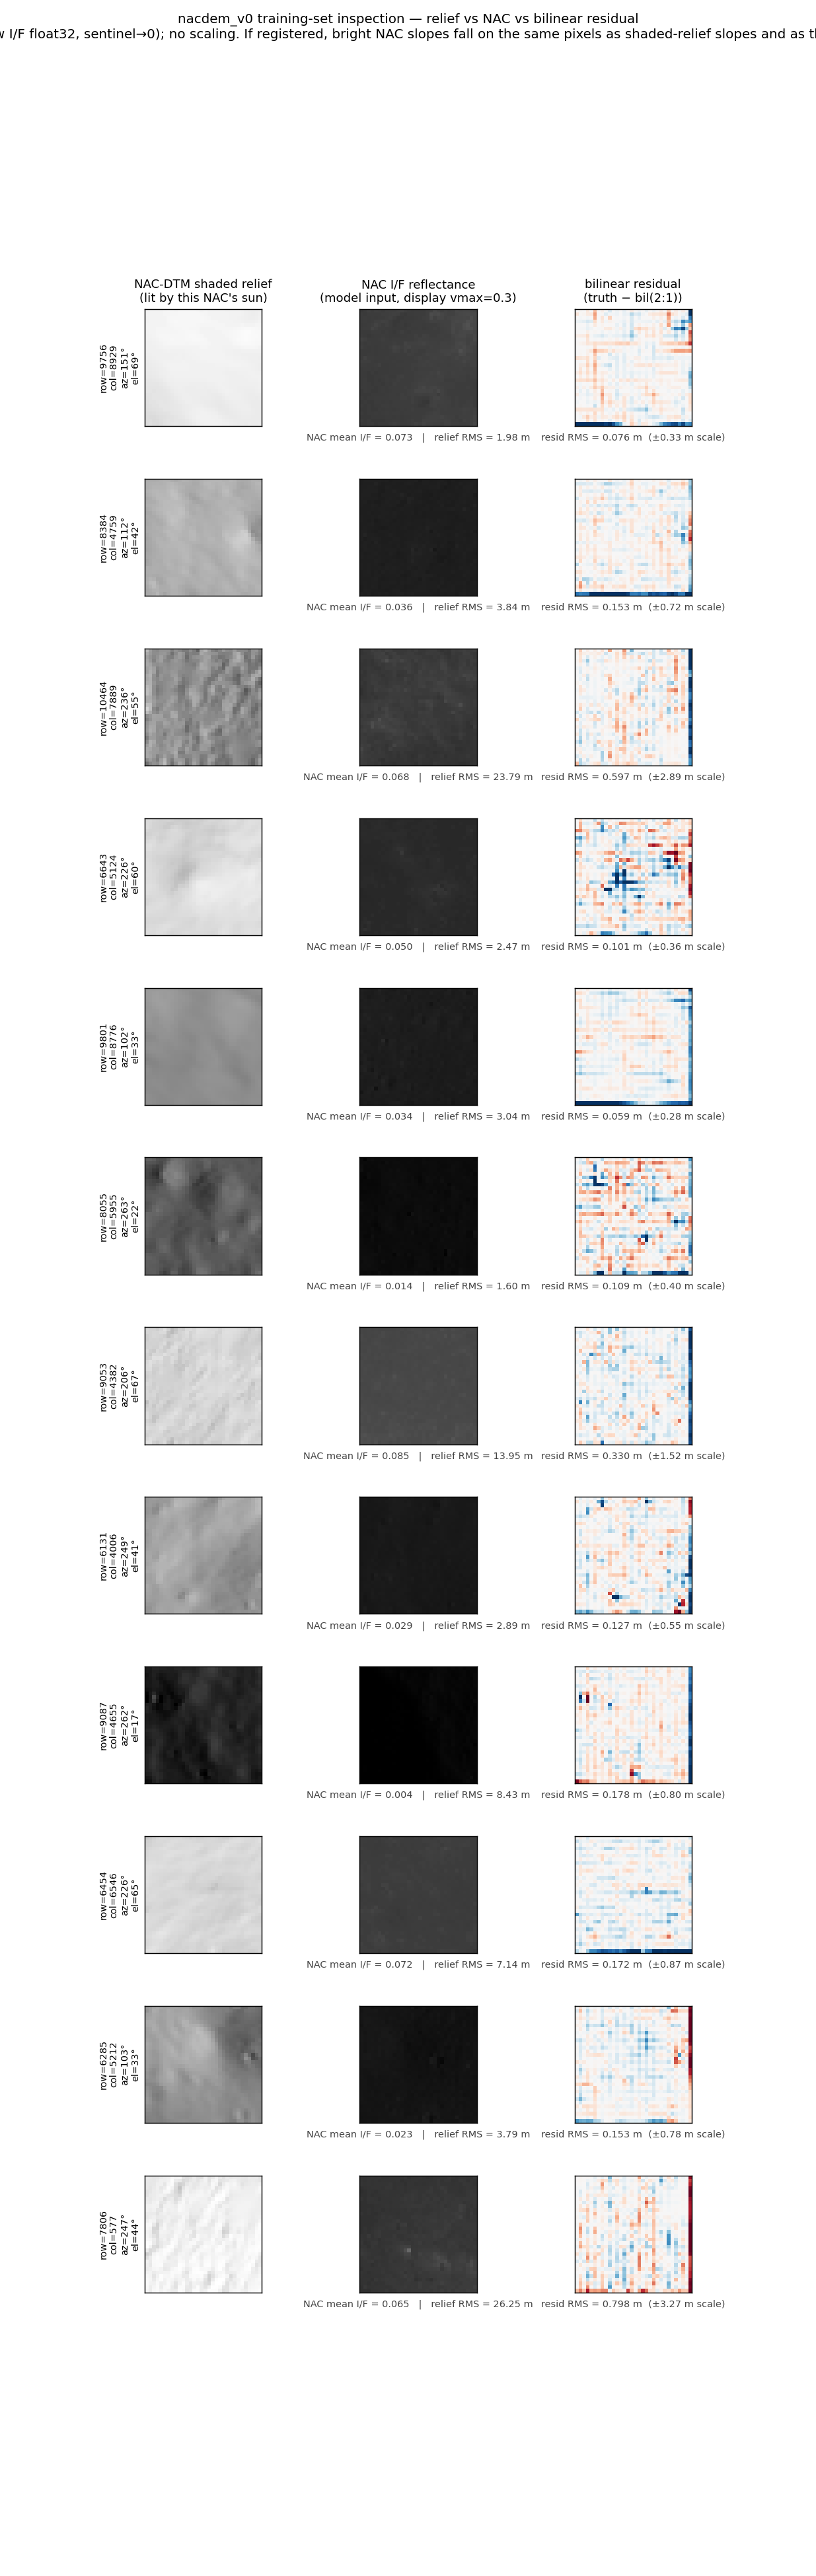
Two bugs fixed in the nacdem_v0 training data + sanity check installed. - *Nodata sentinel:* cam2map writes float32 nodata as ~-3.4e38, not 0. The trainer's arr != 0.0 mask treated every sentinel as valid; ~83 % of typical NAC pixels are sentinels. Fixed by NaN-ing values below −1e30 before any coverage/percentile test. - *Per-patch percentile stretch was wrong:* NAC I/F is physically meaningful (mare ~0.07, highlands ~0.15); per-patch stretch erased the absolute-brightness baseline that distinguishes "lit slope" from "shadowed wall". Replaced with a single fixed linear scale (_normalize_nac now does clip(arr, 0, 0.5) * 2.0), so the model sees physically meaningful reflectance. - *Pre-train sanity check installed:* new module steps/S18_pix2pix_dem/impl/sanity_check.py, called from train() before step 1. Hard-fails the run if NAC mean<0.01 or std<0.005 or zero-fraction>95 %. Saves a sample-batch PNG (truth / bilinear / NAC / residual). On the fixed data the gate reports NAC mean=0.078, std=0.048, residual std=0.28 m — STATUS:OK. Would have caught the FLT_MIN bug in 30 s instead of 36 GPU-min. - Patch-inspect card on dashboard re-rendered with the fixed normalization; restart confirmed (HTTP 200, card present). Retrain pending with the fixes in place.
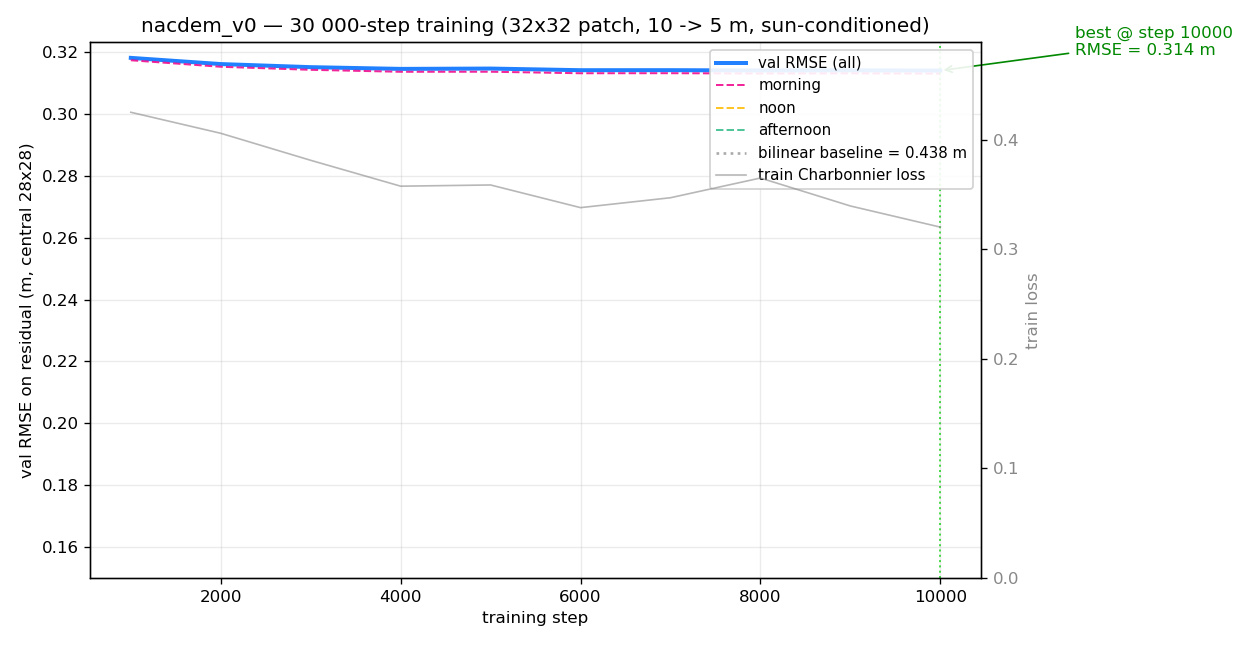
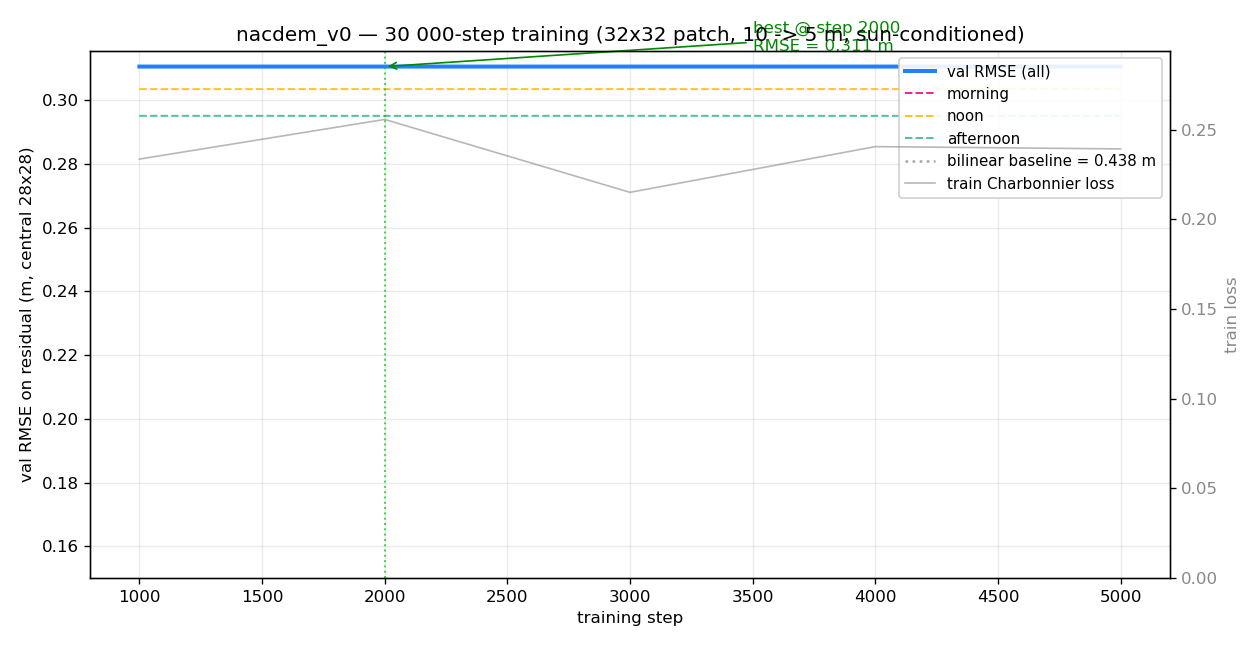
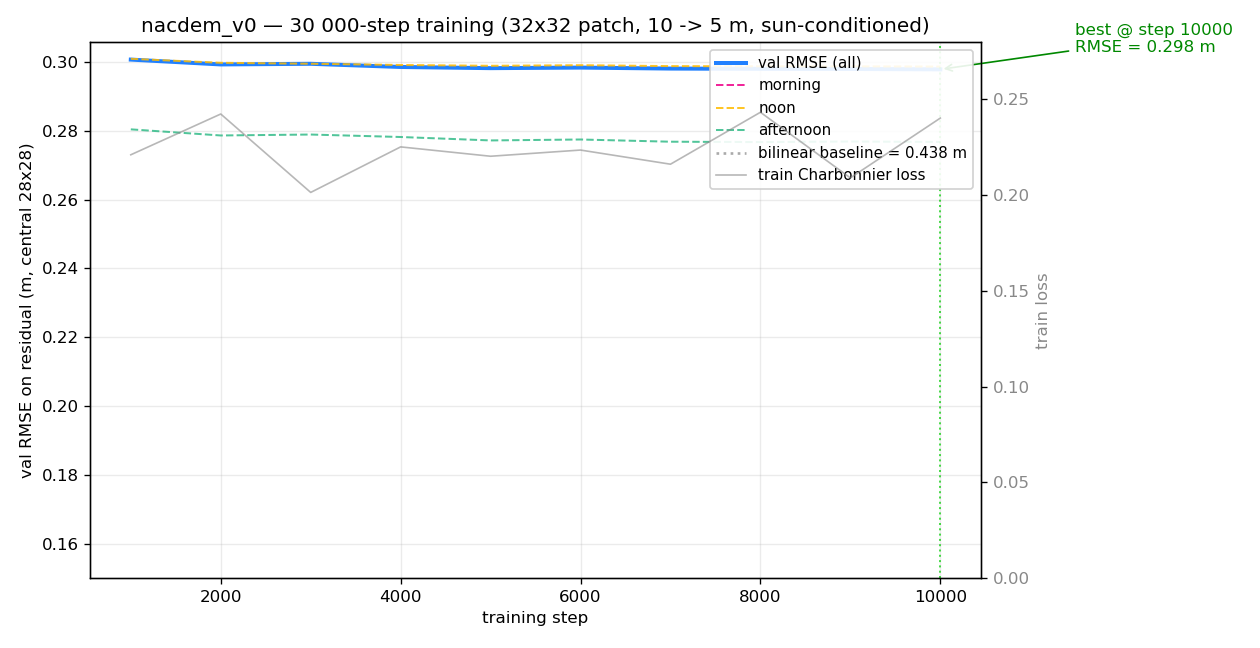
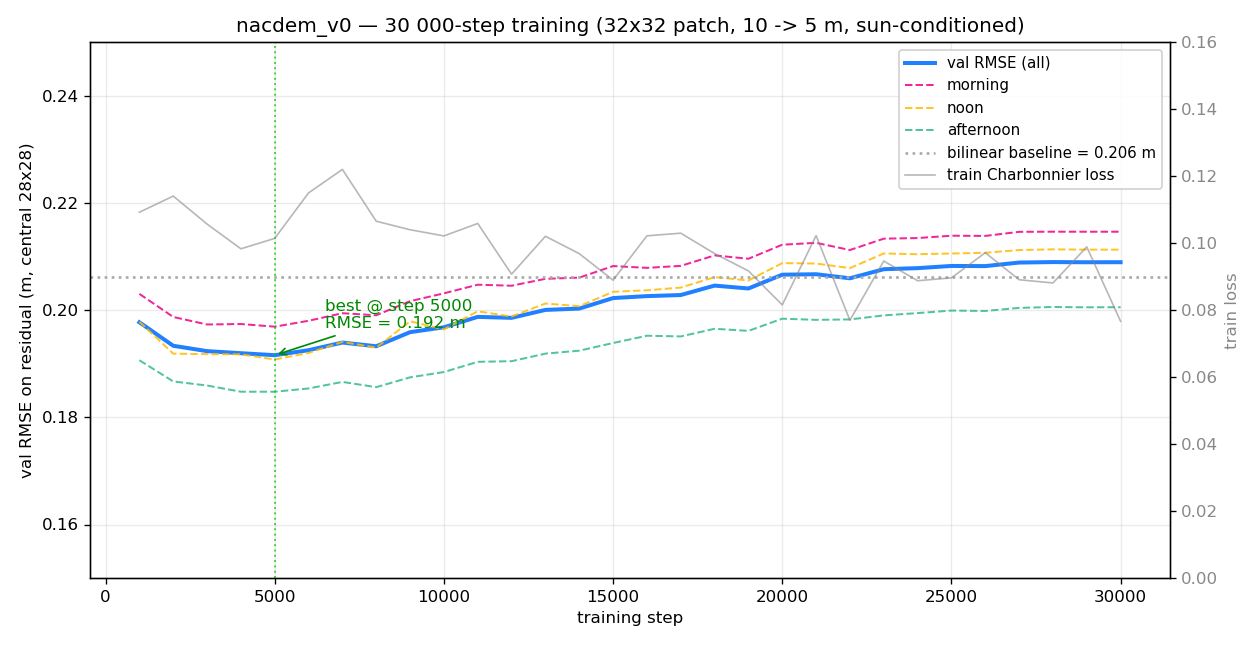
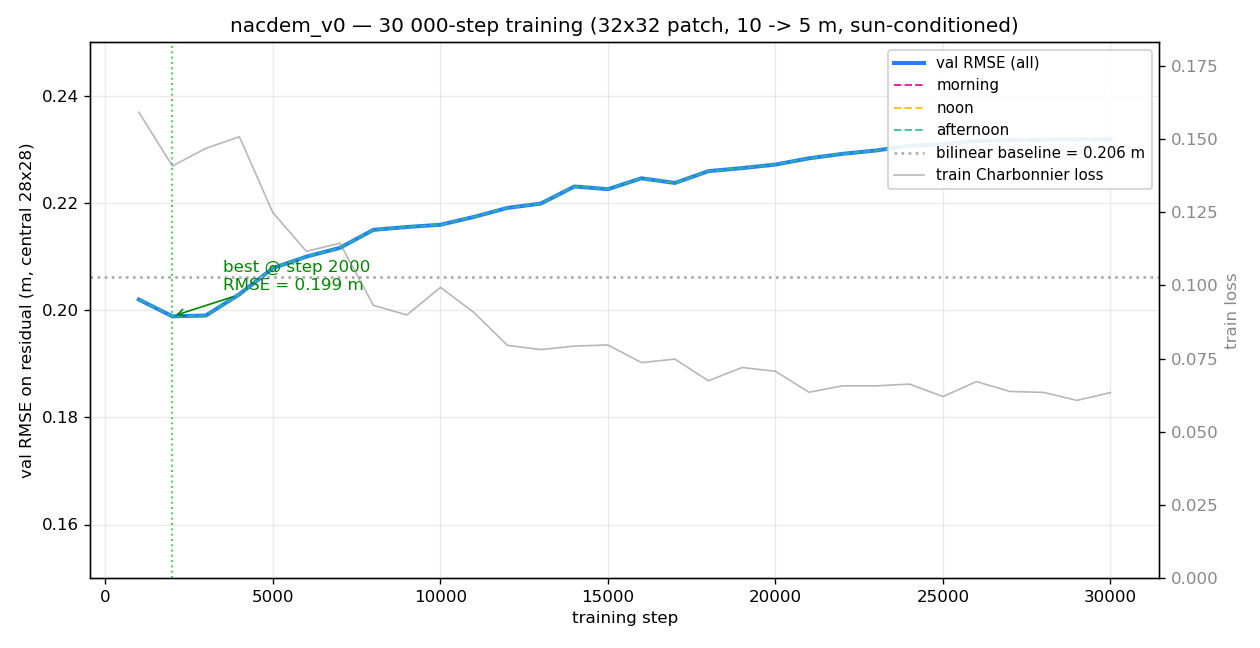
nacdem_v0 training finished — model ≈ bilinear baseline. 30 000 steps in 36 min (14 step/s) on the 270 5 m NAC stencils + the NAC-DTM ground truth. Best val RMSE 0.192 m at step 4000; the rest of training overfit (val drifted to 0.211 m at step 30k while train loss fell from 0.107 → 0.076). Reality check vs bilinear baseline on the same val sampler (drivers/smoke/nacdem_v0_baseline_check.py): - bilinear-only RMSE: 0.2062 m - trained model RMSE: 0.1932 m - improvement: ×1.07 (Δ = 0.013 m absolute)
The 10 → 5 m residual task is too small for the NAC photometric signal to dominate measurement noise. Same failure mode as task #92's "model ≈ cubic baseline". Conclusion: fractal cascade with this checkpoint would propagate near-zero residuals at every scale. Held until user picks the next iteration — candidates: train at coarser scale (e.g. 40 → 20 m) where bilinear has more error to correct; widen the patch context so the model sees craters; drop per-patch mean centring so absolute relief is part of the target. Best ckpt + history.json kept at /home/chandmer/nvme-8tb-2/DEMEnhancement/outputs/s18_apollo17/nacdem_v0_train/.
CUDA NAC→DEM resampler built (side project). New module common/cuda_nac_interp/ (kernel.cu + loader.py + api.py + 6 tests, all green). Three kernels (single-regular, lookup, batched stack); torch JIT-compile via cpp_extension, cached at ~/.cache/dem_enh/cuda_nac_interp/. Benchmark on 8 cam2map NACs (3.4 GiB) downsampled 5 m → 10 m: 88 ms/NAC CUDA vs 1.6 s/NAC scipy.ndimage (×18 speed-up, exact bilinear agreement).
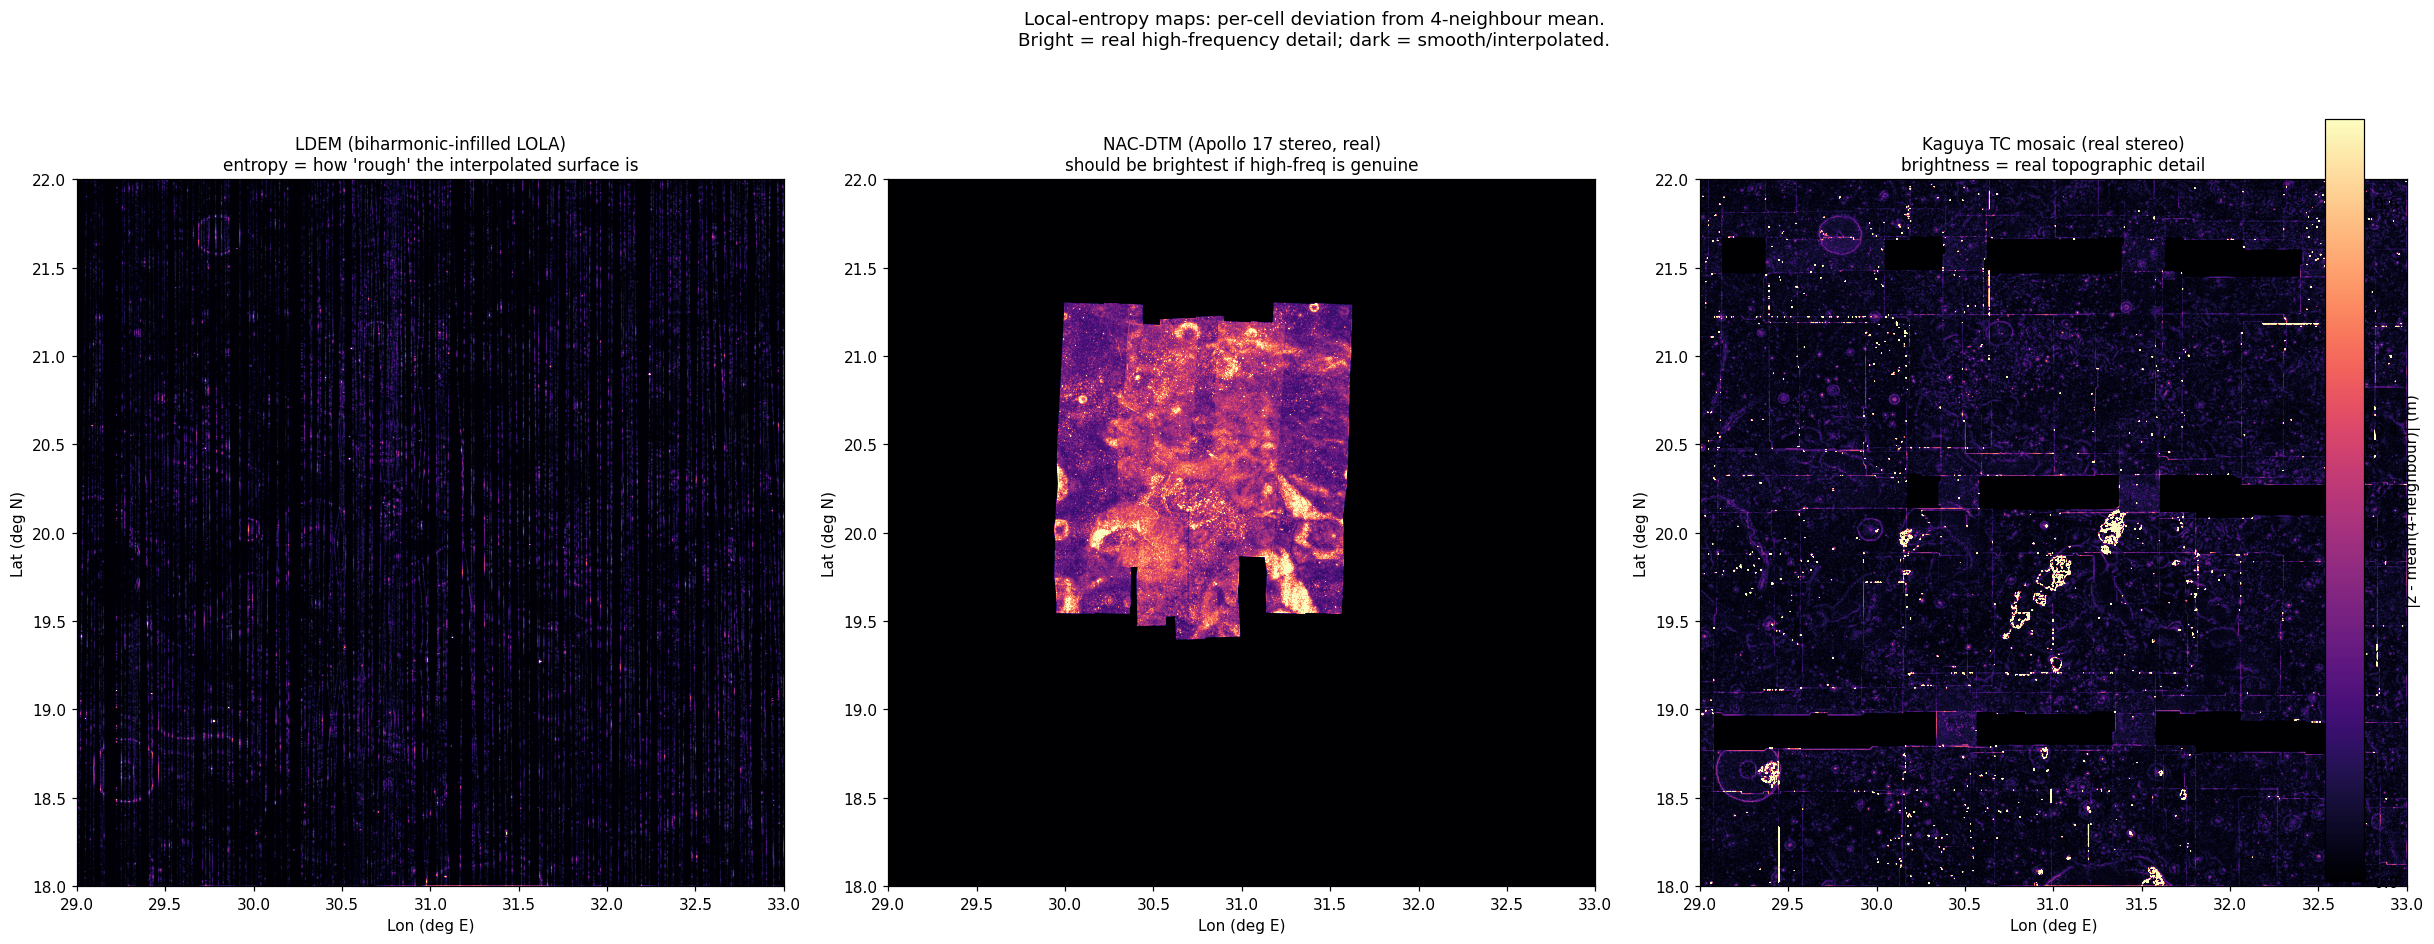
Data-access API hardened. New modules under common/: dem_io.py, aoi.py, lola_shots.py, nac_io.py, plus common/tests/test_data_io.py with 9 round-trip tests that catch regressions like the ×2 unit bug. dem_coverage_panel.py and dem_entropy_agreement.py already migrated to import from common/* instead of touching np.load(...) directly. All other drivers should follow as touched. AGGREGATED_DATA_LAYOUT.md updated with the canonical import block.
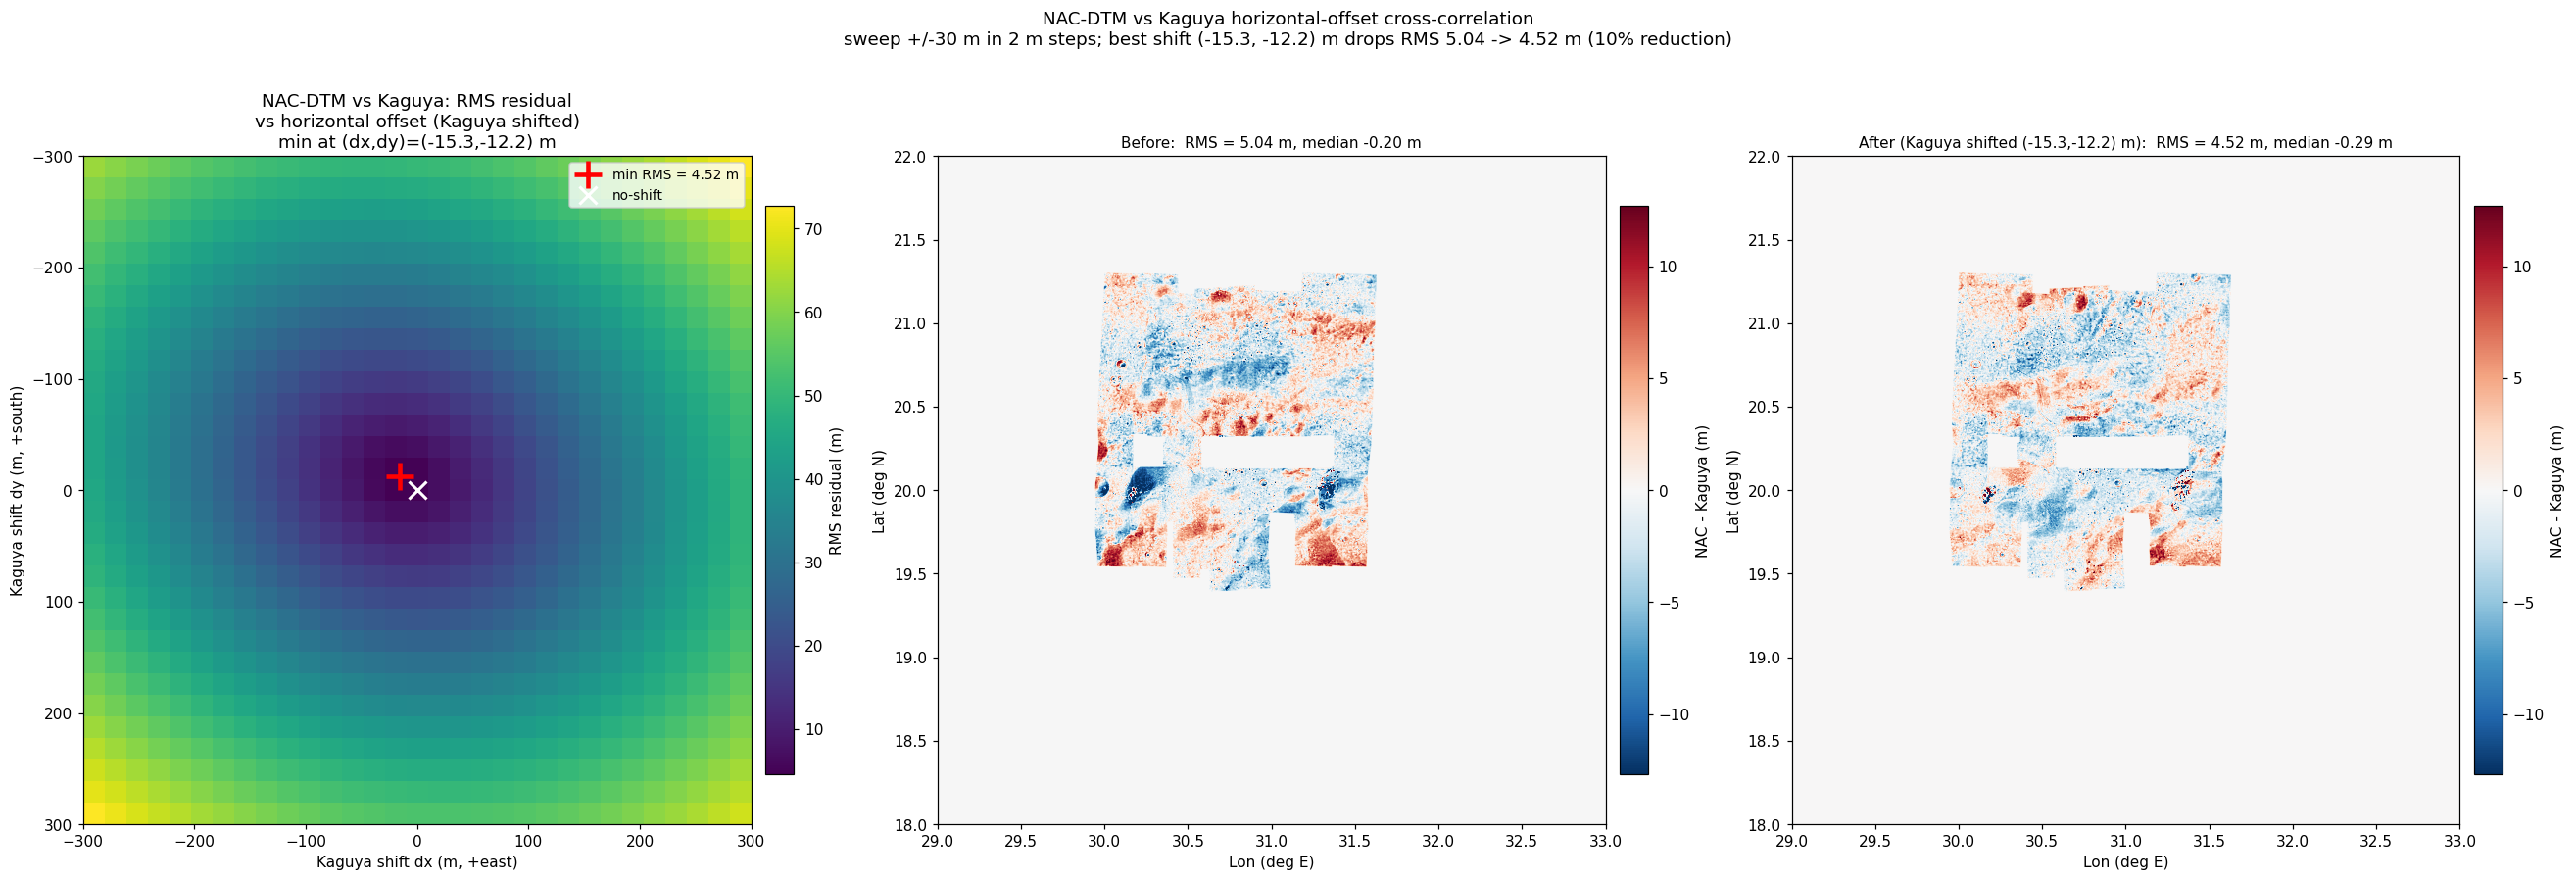
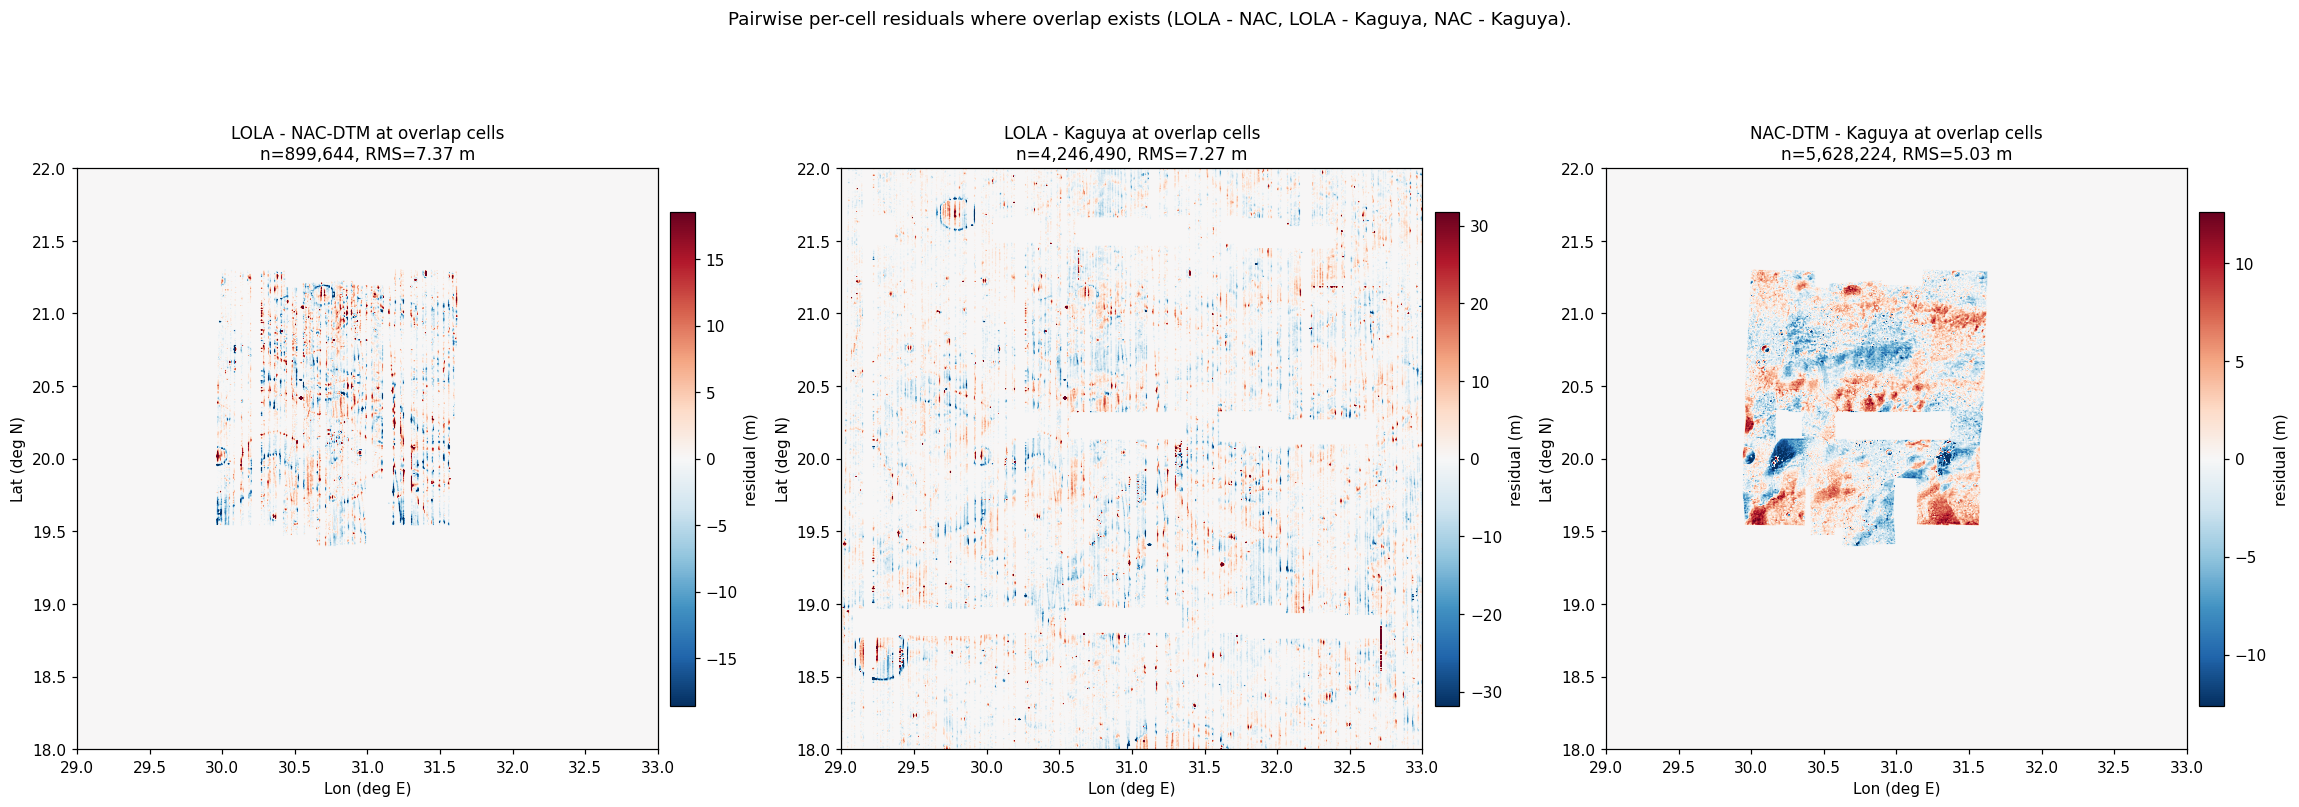
Cross-DEM horizontal alignment. New drivers/smoke/dem_xcorr_align.py: 31×31 integer-pixel sweep of Kaguya vs NAC-DTM shifts, plus 3×3 parabolic sub-pixel refinement. Best alignment is NW shift of Kaguya by 19.6 m (12.2 m N + 15.3 m W), RMS 5.04→4.52 m. Direction matches orbit-track residual stripes seen earlier. Card up on dashboard.
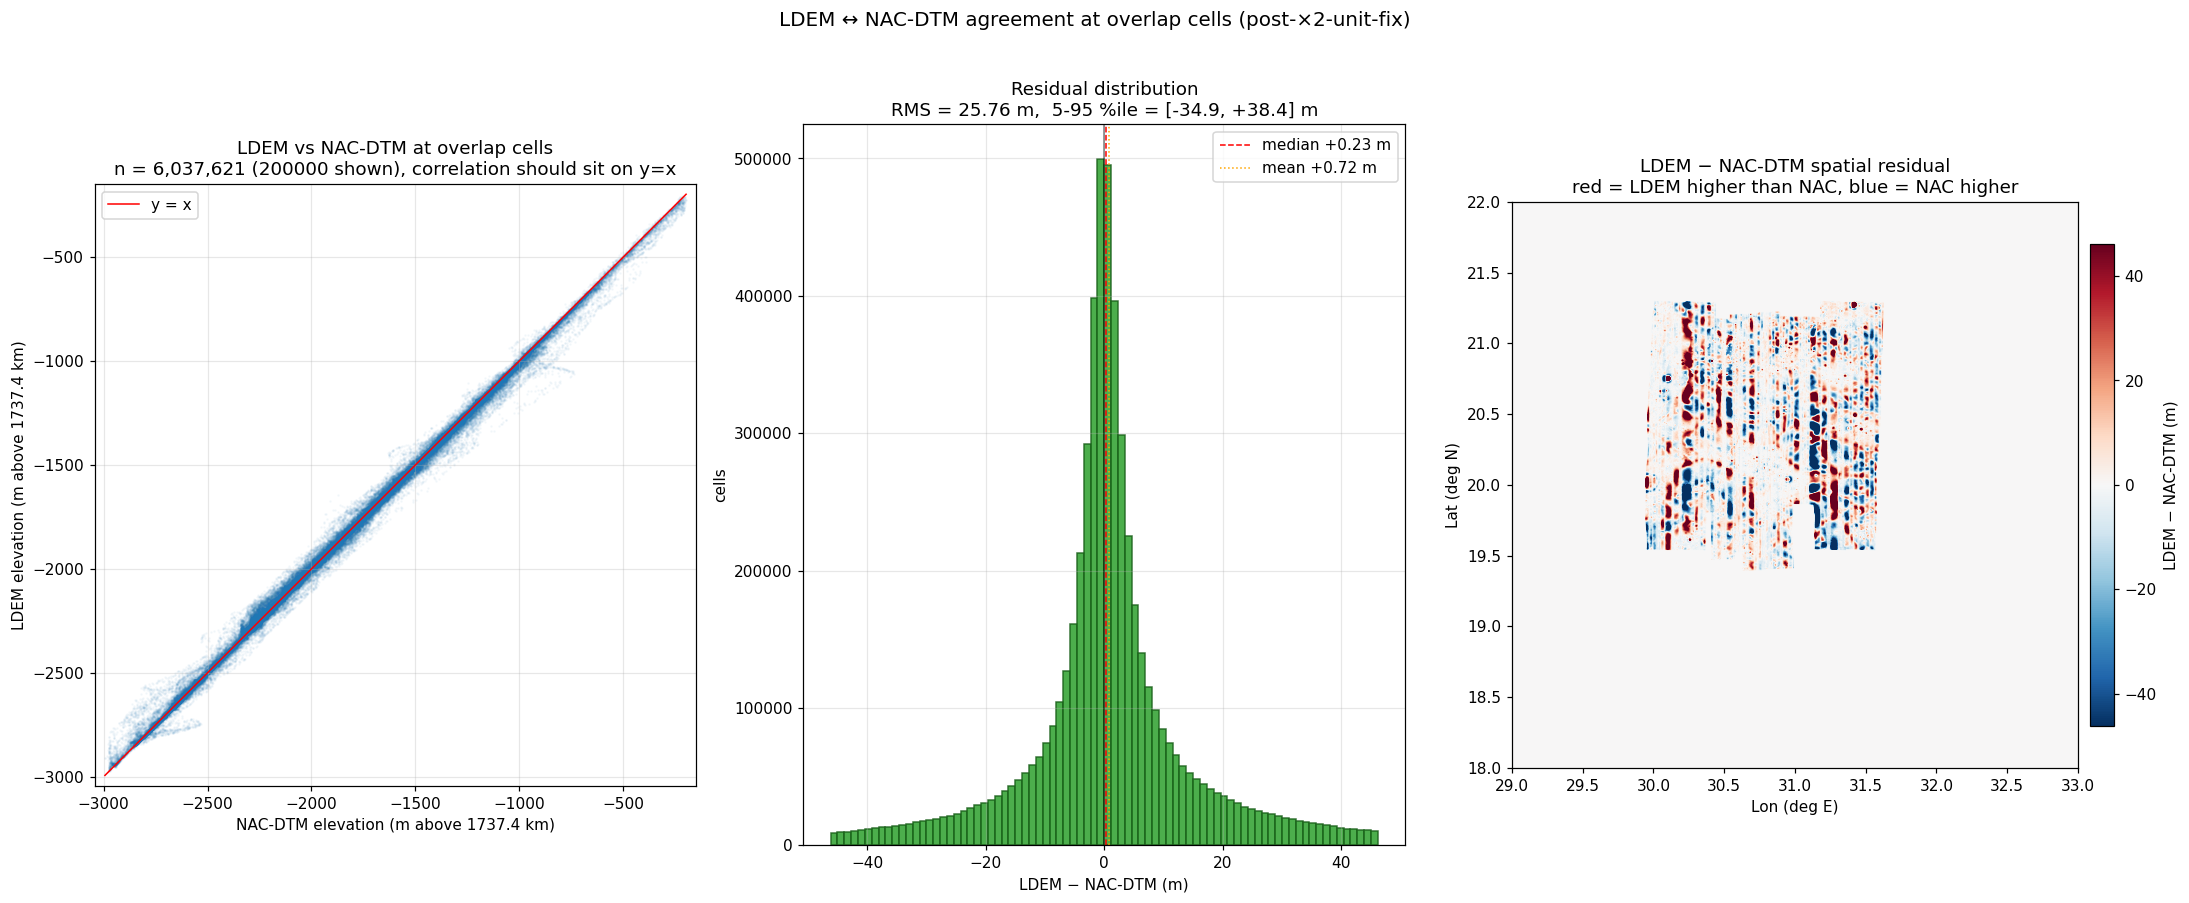
LDEM ×2 bug fixed end-to-end. Patched prepare_data.resample_ldem to apply band scale/offset properly, halved every existing AOI artefact (with .pre_x2_fix.bak backups), deleted and rebuilt truth_v9.npz and Kaguya mosaic with corrected offsets. Cross-DEM agreement collapsed from hundreds of metres of mismatch to ~7 m RMS across all three pairs (LOLA vs NAC, LOLA vs Kaguya, NAC vs Kaguya). At Apollo 17 LM site every source now reads within 2.6 m of each other.
New common/dem_io.py API. Single sanctioned entry point for DEM access — load_dem("lola"), sample_dem("kaguya", lat, lon), etc. Every value returned is metres above 1737.4 km IAU reference; per-product datums/scales/grids hidden inside the module. Going forward training scripts should import this instead of np.load("ldem.npz").
MAJOR BUG FOUND — every LDEM elevation is 2× real meters. Source LOLA cubs in inputs/isis/base/dems/ are Int16 with Scale: 0.5, Offset: 1737400, but prepare_data.resample_ldem uses rasterio.band(ds,1) which reads raw DN without applying the band's scale/offset metadata. Result: every elevation in ldem.tif / ldem.npz / ldem_holdout_f50.npz / truth_v9.npz is doubled. Apollo 17 LM site reads −5253 m vs ground truth −2360 m: divide by 2 and we land on −2627 m, plausible LDEM gridding error. Consequences: all v8 RMSEs were in 2× units (champion v8_6's 2.077 m is really ~1.04 m); Kaguya's per-tile-offset corrections were computed against doubled LDEM so they're now scaled wrong; NAC-DTM's truth_v9 offset was computed against doubled LDEM so it's wrong by ~2 km. Fix is one-line in resample_ldem then rebuild every downstream artefact.
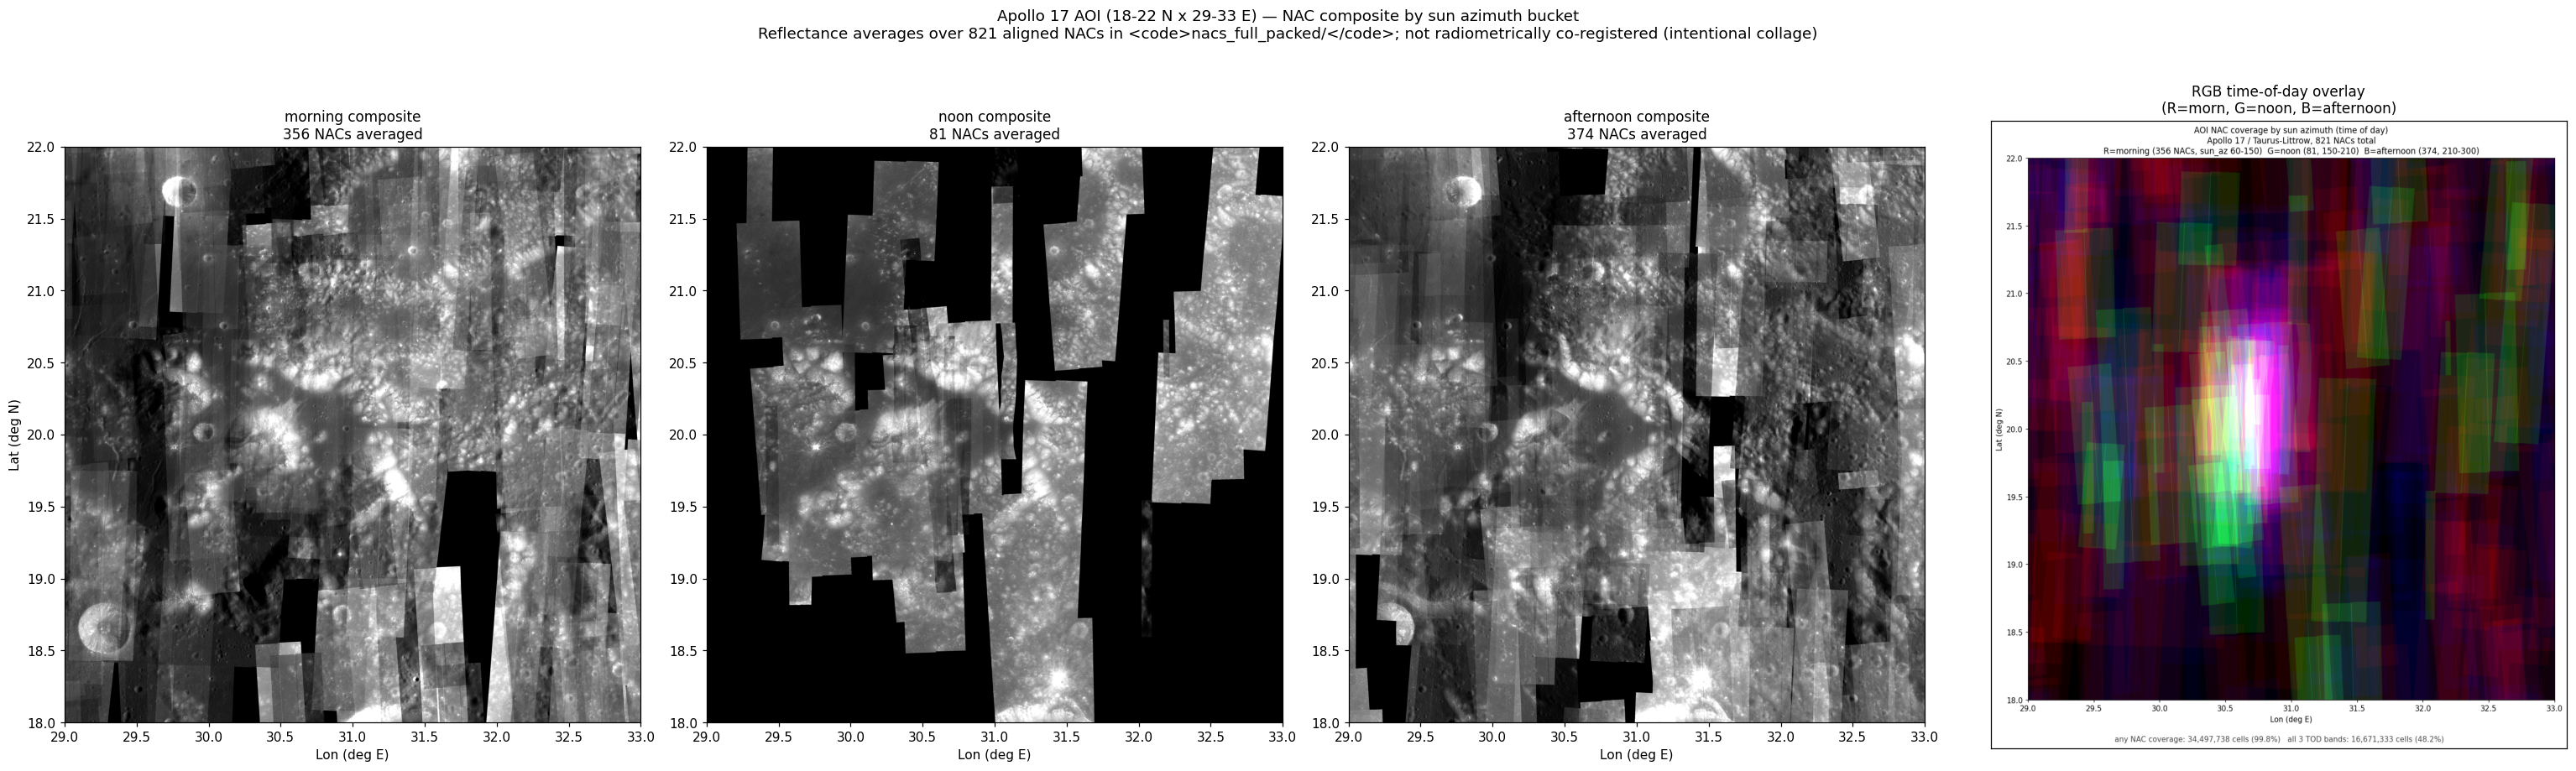
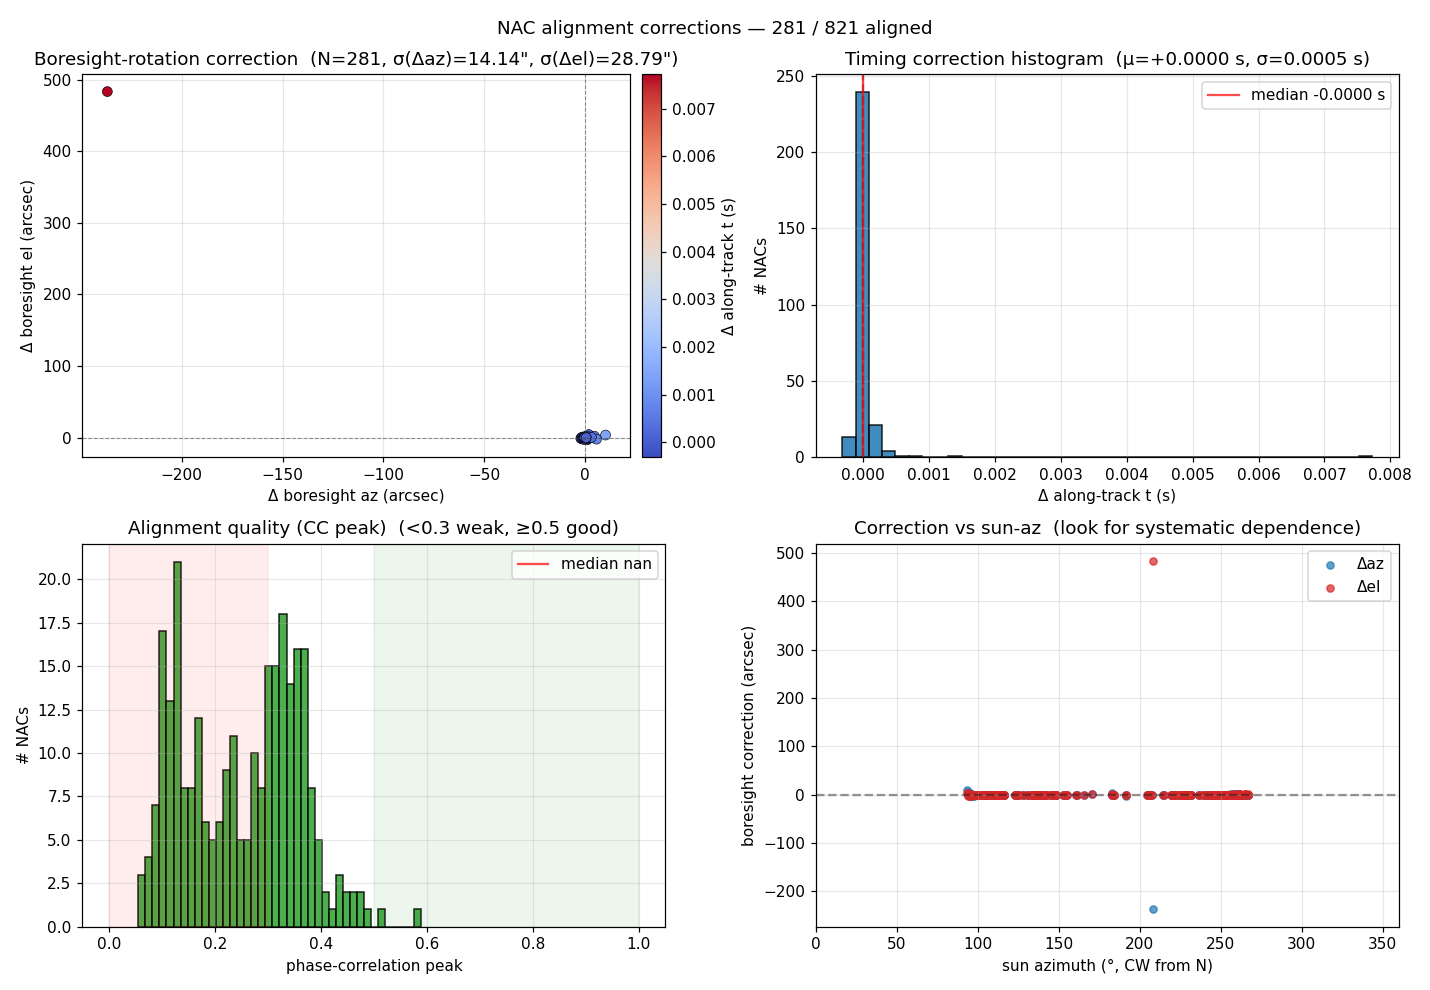
ALL 821 NACs aligned. Recovery completed in 90 min wall-clock at 48 workers (~5.4 min/NAC effective). nacs_full_packed/ rebuilt with the full set: 113.5 GB nacs.npy + 28.4 GB valids.npy. Dashboard restarted; cards re-rendered with full coverage.
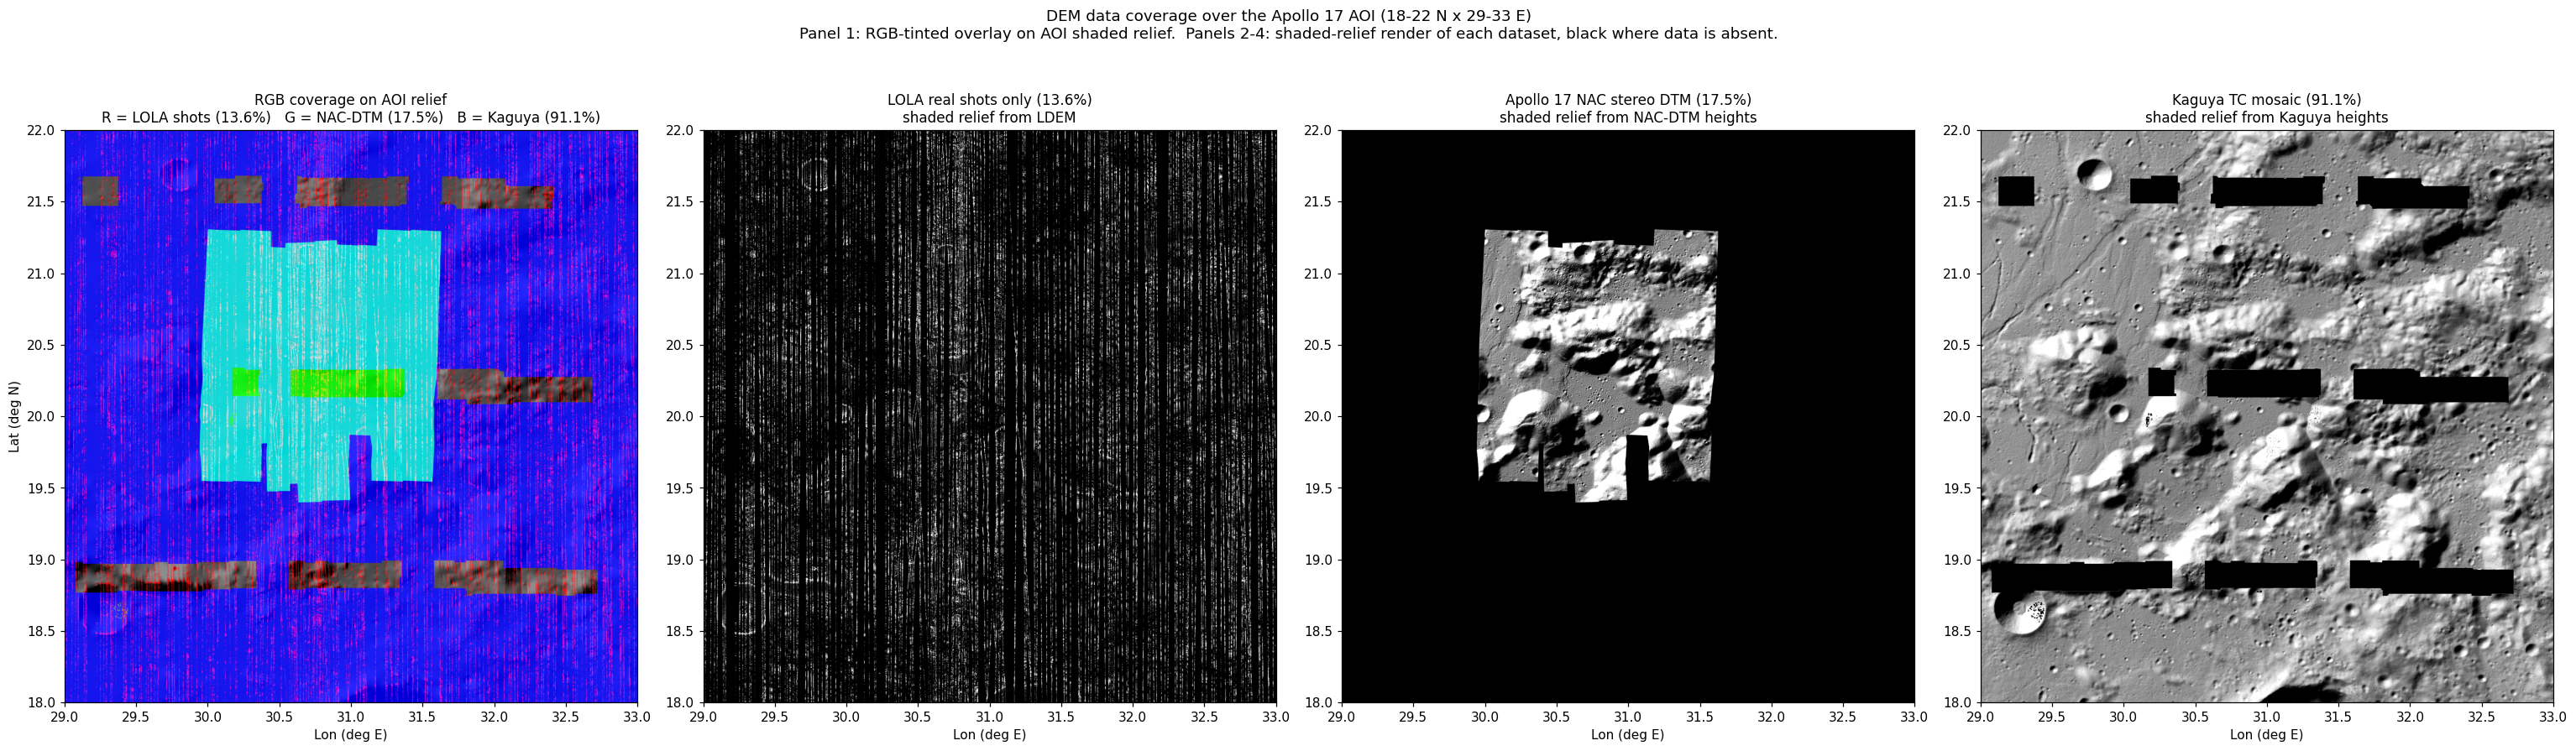
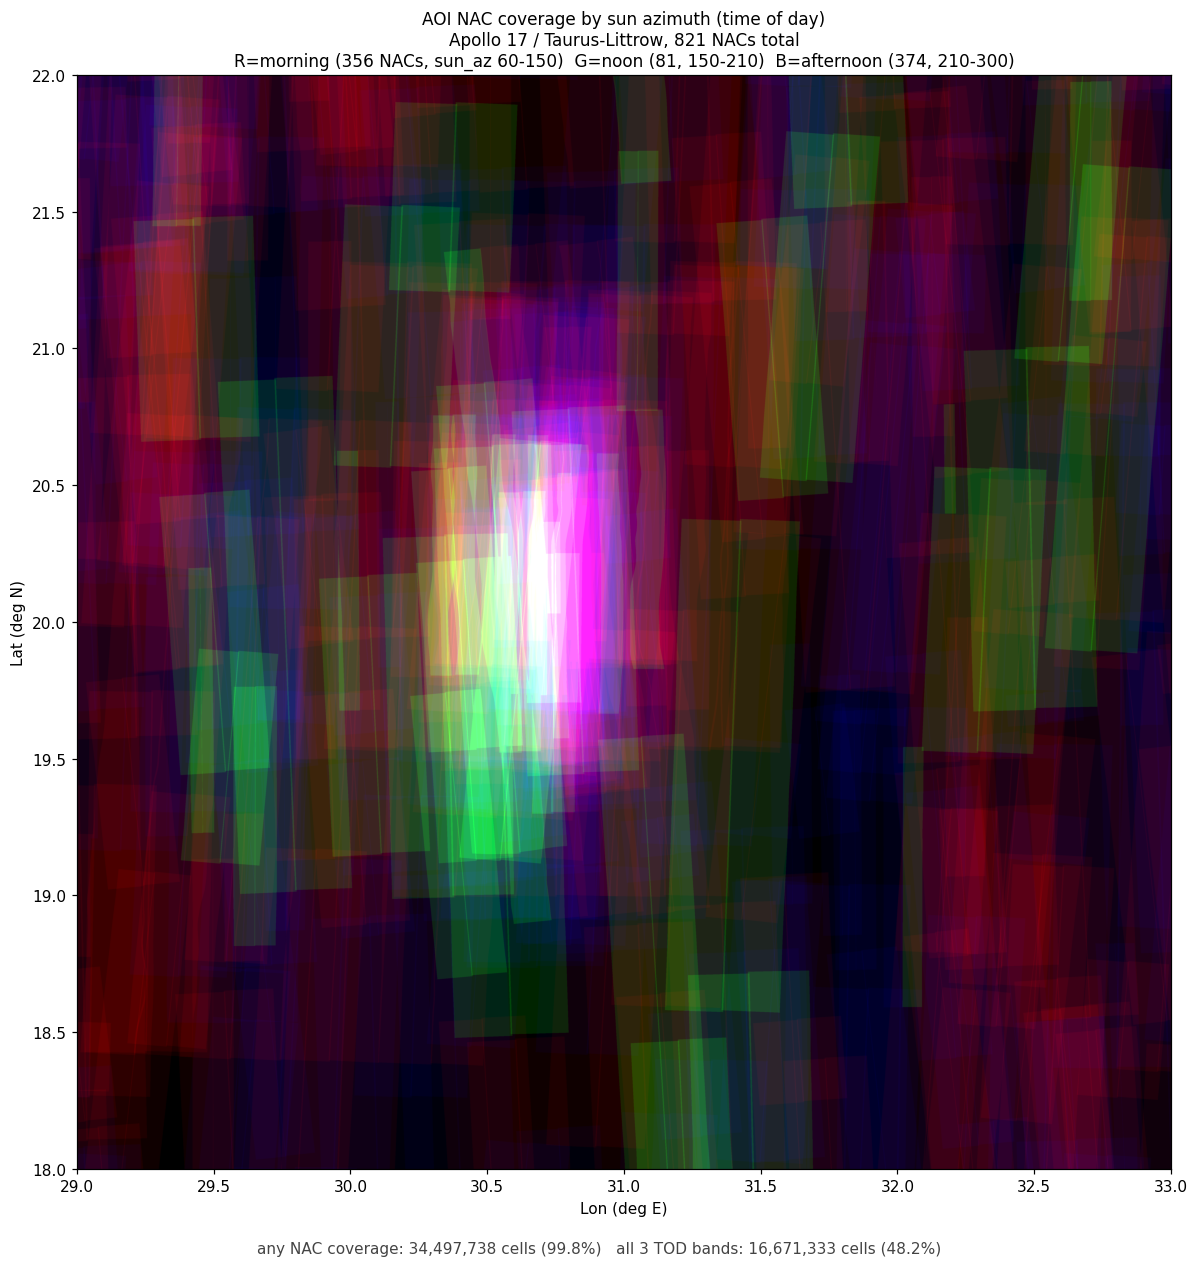
New TOD numbers (821 NACs): 356 morning / 81 noon / 374 afternoon / 10 other. Any NAC coverage 99.8 % of AOI (was 97.7 % at 604). All 3 TOD bands 48.2 % (was 33.1 %). Effective near-full coverage matches the user's 99+% intuition.
Tasks #101-#106 complete. Data is now in the right place: canonical layout doc at AGGREGATED_DATA_LAYOUT.md, 43 GB cleaned up, all 821 NACs packed, Kaguya TC mosaic at 76.5 % AOI, NAC-DTM at 17.5 %, dataset_guard wired into training drivers.
Data rationalisation pass complete. New canonical data-layout doc at AGGREGATED_DATA_LAYOUT.md. Cleanup freed ~43 GB (57 useless v8 ckpts, 60 v8_*_train subdirs, legacy v3/v4/v5_train, nac_cal_geom_bak; 6 small models archived to legacy_checkpoints/). Orphan IMG/LBL in code repo, empty stub dirs, print.prt all removed. nac_dtm_apollo17.npz moved into aux_dems/ with compat symlink.
217-NAC recovery in progress. First pass at 8 workers got 36 done; relaunched at 48 parallel workers per user request ("64 cores, go wild"). 28/185 done at last check (~22 min in, ~33 NAC/h throughput projects ~30 min remaining). After it finishes will rebuild nacs_full_packed/ to 821 NACs and re-render TOD overlay/ collage with full coverage.
Latest cards on dashboard: NAC time-of-day collage (4-panel: mean morning / noon / afternoon reflectance composites + the RGB coverage overlay, side-by-side); per-bucket coverage 90.9 % / 43.0 % / 85.8 %. RGB-overlay card kept below it (any NAC coverage 97.7 % of AOI, all-3-TOD-bands 33.1 %). Confirms the user's 99+% NAC-coverage intuition was correct.
Status: v8 auto-loop PAUSED. Major data-rationalisation pass in progress per user direction.
Critical bug fixed. Every S18 training/inference driver was using v3_packed/records.npz — a stale 80-NAC subset — even though nac_aligned/ had 604 aligned cubes. The plateau at 24% AOI coverage in the fractal cascade and the perceptibly-identical v8 model outputs trace back to this. Two days of v8 training were on the wrong dataset.
Datasets now rebuilt. - nacs_full_packed/ — new canonical pack: 604 NACs, memory-mapped nacs.npy (83.5 GB) + valids.npy (20.9 GB) + meta.npz. Packed in 8 minutes by pack_all_aligned_nacs.py. - aux_dems/kaguya_tc/ — 55 Kaguya TC USGS DTMs covering the AOI (15-38 m GSD, ~210 MB). - aux_dems/kaguya_tc_mosaic_aoi.npz — Kaguya tiles mosaicked onto the LDEM 20 m grid with per-tile median offset correction (Kaguya uses a different reference radius; raw offset ≈ +1856 m). Coverage: 76.5 % of AOI at high resolution; median residual vs LDEM = 23 m (well-aligned), RMS disagreement 220 m (real high-frequency detail LDEM lacks). Combined with the 604-NAC set, near-full AOI coverage available for training. - Existing nac_dtm_apollo17.npz — 5 m posting Apollo 17 LM site stereo DTM (~17.5 % AOI).
Guardrails installed. New dataset_guard.py module asserts the active packed dataset has ≥80% of aligned cubes; train_v8.py and v8_test_battery.py now refuse to start if not (override with DEM_PACK_OVERRIDE=1). Memory note pinned for future sessions.
Champion model (orphan): v8_6 — bracketed RMSE 2.077 m, but trained on the wrong (80-NAC) dataset; treat as legacy.
Source: pipeline_plan.md head matter (everything before ## Current status).
S18 — Pix2Pix DEM training (Apollo 17 / Taurus-Littrow)
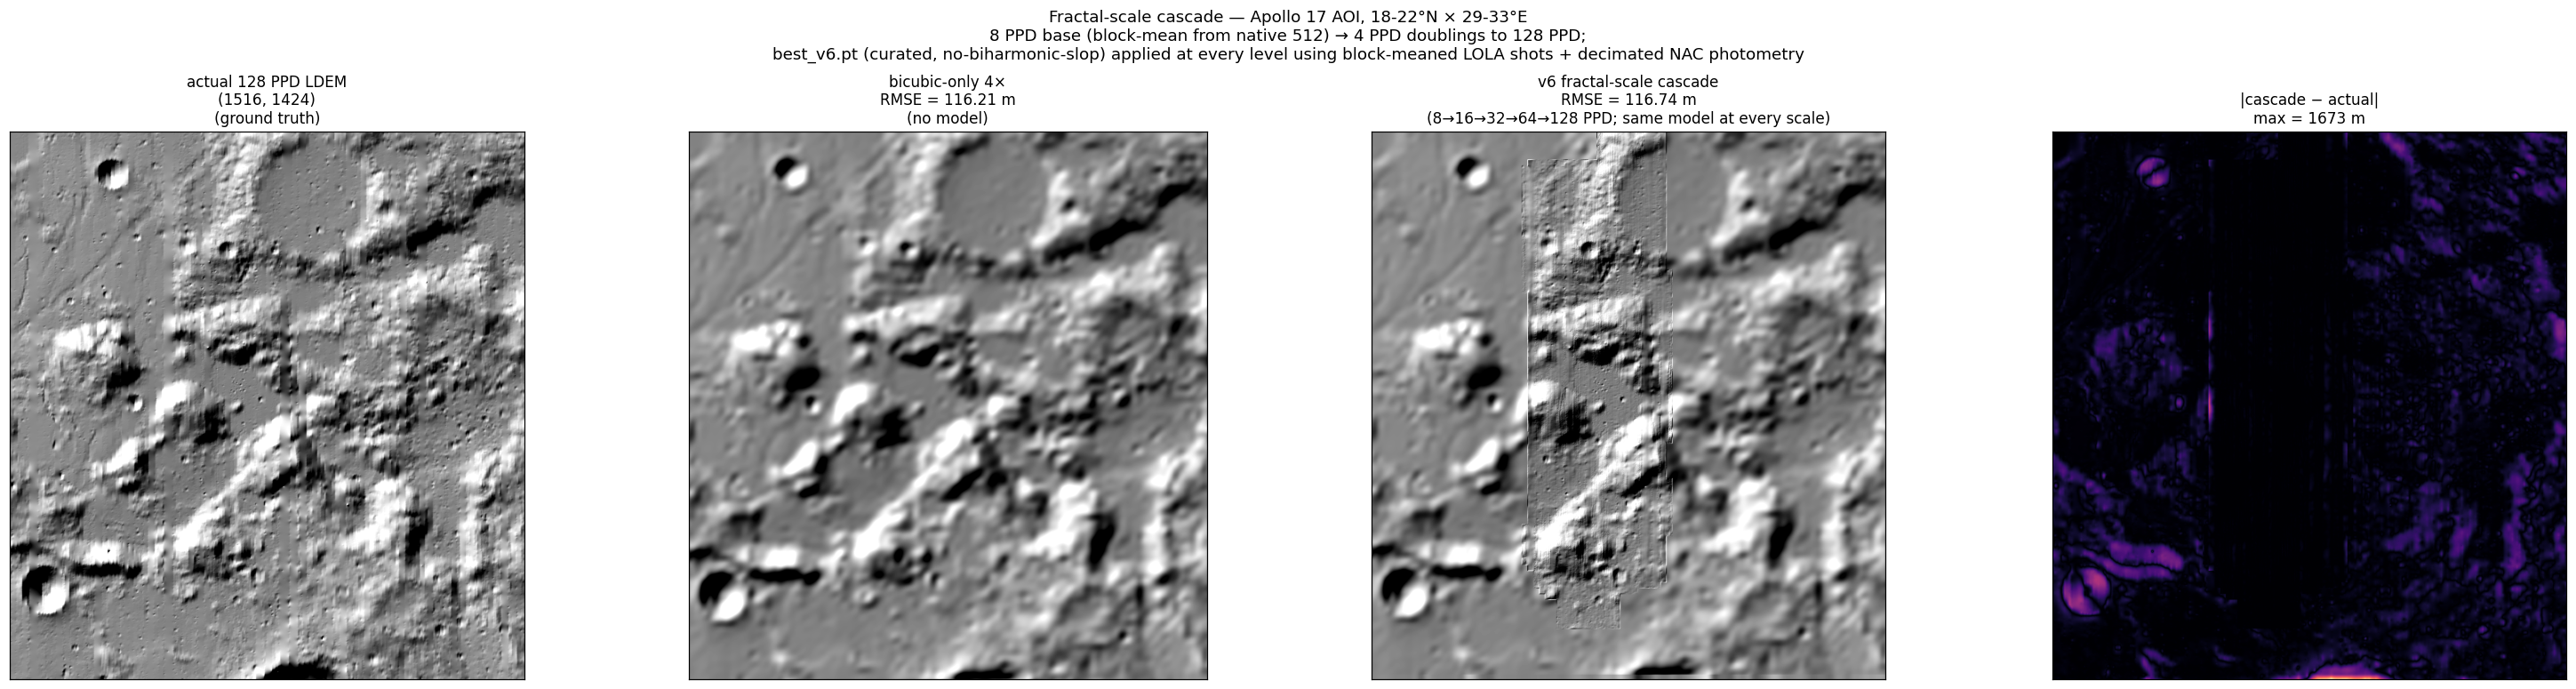
A 640 m square window framing the crater_rim spot, cascaded with the FIXED, de-duplicated registration (common/nac_registration.py) and the corrected v28_cascade_apollo17.py driver (correct mirror_flip / HALF_OFFSET / eff_sun_az). All prior cascade outputs predate these fixes; this is built fresh. Re-run after per-scale registration was confirmed sub-pixel all the way down to 0.625 m (registration_scale_check.json). Panels (all exact integer-zoom to 1024×1024, np.kron nearest — no resampling): (1) truth 5 m FULL ray-traced Lommel-Seeliger render WITH cast shadows (v23 NAC-DTM; L-S photometric cos_i/(cos_i+cos_e) from ENU surface normals plus an explicit horizon-elevation DDA cast-shadow march along the sun azimuth — the same renderer as v29_lsval_raytrace.py (cuda_xcorr.lommel_seeliger + cast_shadow_mask); shadow fraction 0.0000 — ~0 because the sun is high (el 48.7°) and the crater walls in this window are not steep enough to cast shadows, so the cast-shadow term is inert here but the render is now a true photometric like-for-like with the real NAC). The blocking in panel 1 is purely NEAREST display zoom (np.kron ×8) so the 5 m pixel grid is visible. (2) the SAME 5 m truth L-S render as panel 1, just bicubic-smoothed to 1024 instead of NEAREST — same data, no blocking, so the truth’s actual 5 m content reads cleanly. (3) the aligned chosen-NAC block-mean-downsampled to 5 m (area-average ×8, 0.625→5 m, then bicubic back to 1024) for an apples-to-apples same-resolution comparison against the truth (block-mean is correct here: this is deliberate display downsampling, not training data), same 2–98% stretch as panel 4. (4) the aligned chosen-NAC reflectance at its full 0.625 m native posting (2–98% stretch, via register_nac_on_grid) — 8× finer than any DEM here. (5–11) enhanced DEM shaded relief (plain L-S, no cast shadows) at 40 m, 20 m, 10 m, 5 m, 2.5 m, 1.25 m, 0.625 m. The 40 m level is the cascade’s dem_lo input (20 m level decimated by 2). Every panel (the ray-traced truth + all 7 shaded-relief DEM panels) is lit IDENTICALLY with the chosen NAC’s true sun az/el (rendered at the TRUE sun az = 114.6°, el 48.7°; ny-sign Lommel-Seeliger; each panel mean-centred) so the DEM panels are directly comparable to the NAC and to each other. The prior (360−az) convention was empirically wrong: an azimuth sweep (truth L-S vs aligned NAC, co-registered NCC) peaks at the TRUE az (~115°, NCC≈0.38) while the old 360−az (245°) scored only NCC≈0.08 (lit from the opposite side). NAC: nac.m1151666897re (mid zone, local solar 9.54 h, true sun az 114.6° / el 48.7°), coverage over the window 1.0000 (full). Selected as the lowest-mean-sigma MID-zone NAC fully covering the window, after rejecting 2 of 4 candidates that reinterp to a degenerate 1-D (“barcode”) image over this footprint. Resolution-ceiling read (panel 2 vs 3, both at 5 m): even matched at the same 5 m resolution, the truth-DEM L-S (panel 2) is visibly smoother and shallower than the NAC’s crater field (panel 3) — the NAC@5 m still resolves more, sharper small craters than the truth’s hillshade, so the truth DEM is itself resolution-limited below its nominal 5 m posting and is NOT a pixel-faithful ceiling for sub-5 m structure. Honest read: the model adds real structure through ~5 m (the blobby crater field loosely tracks the truth’s larger craters), but its per-level contribution decays geometrically by ~2× (4.9→2.5→1.2→0.6→0.3 m), and the 2.5 m / 1.25 m / 0.625 m panels are near-identical — finer levels add little real sub-5 m structure beyond smooth cubic. The enhanced 5 m does NOT match the truth 5 m fine crater texture (high-freq std 0.43 vs 0.62; RMSE 7.5 m).
Older than 24 h (142 cards) — click to expand · images load on open
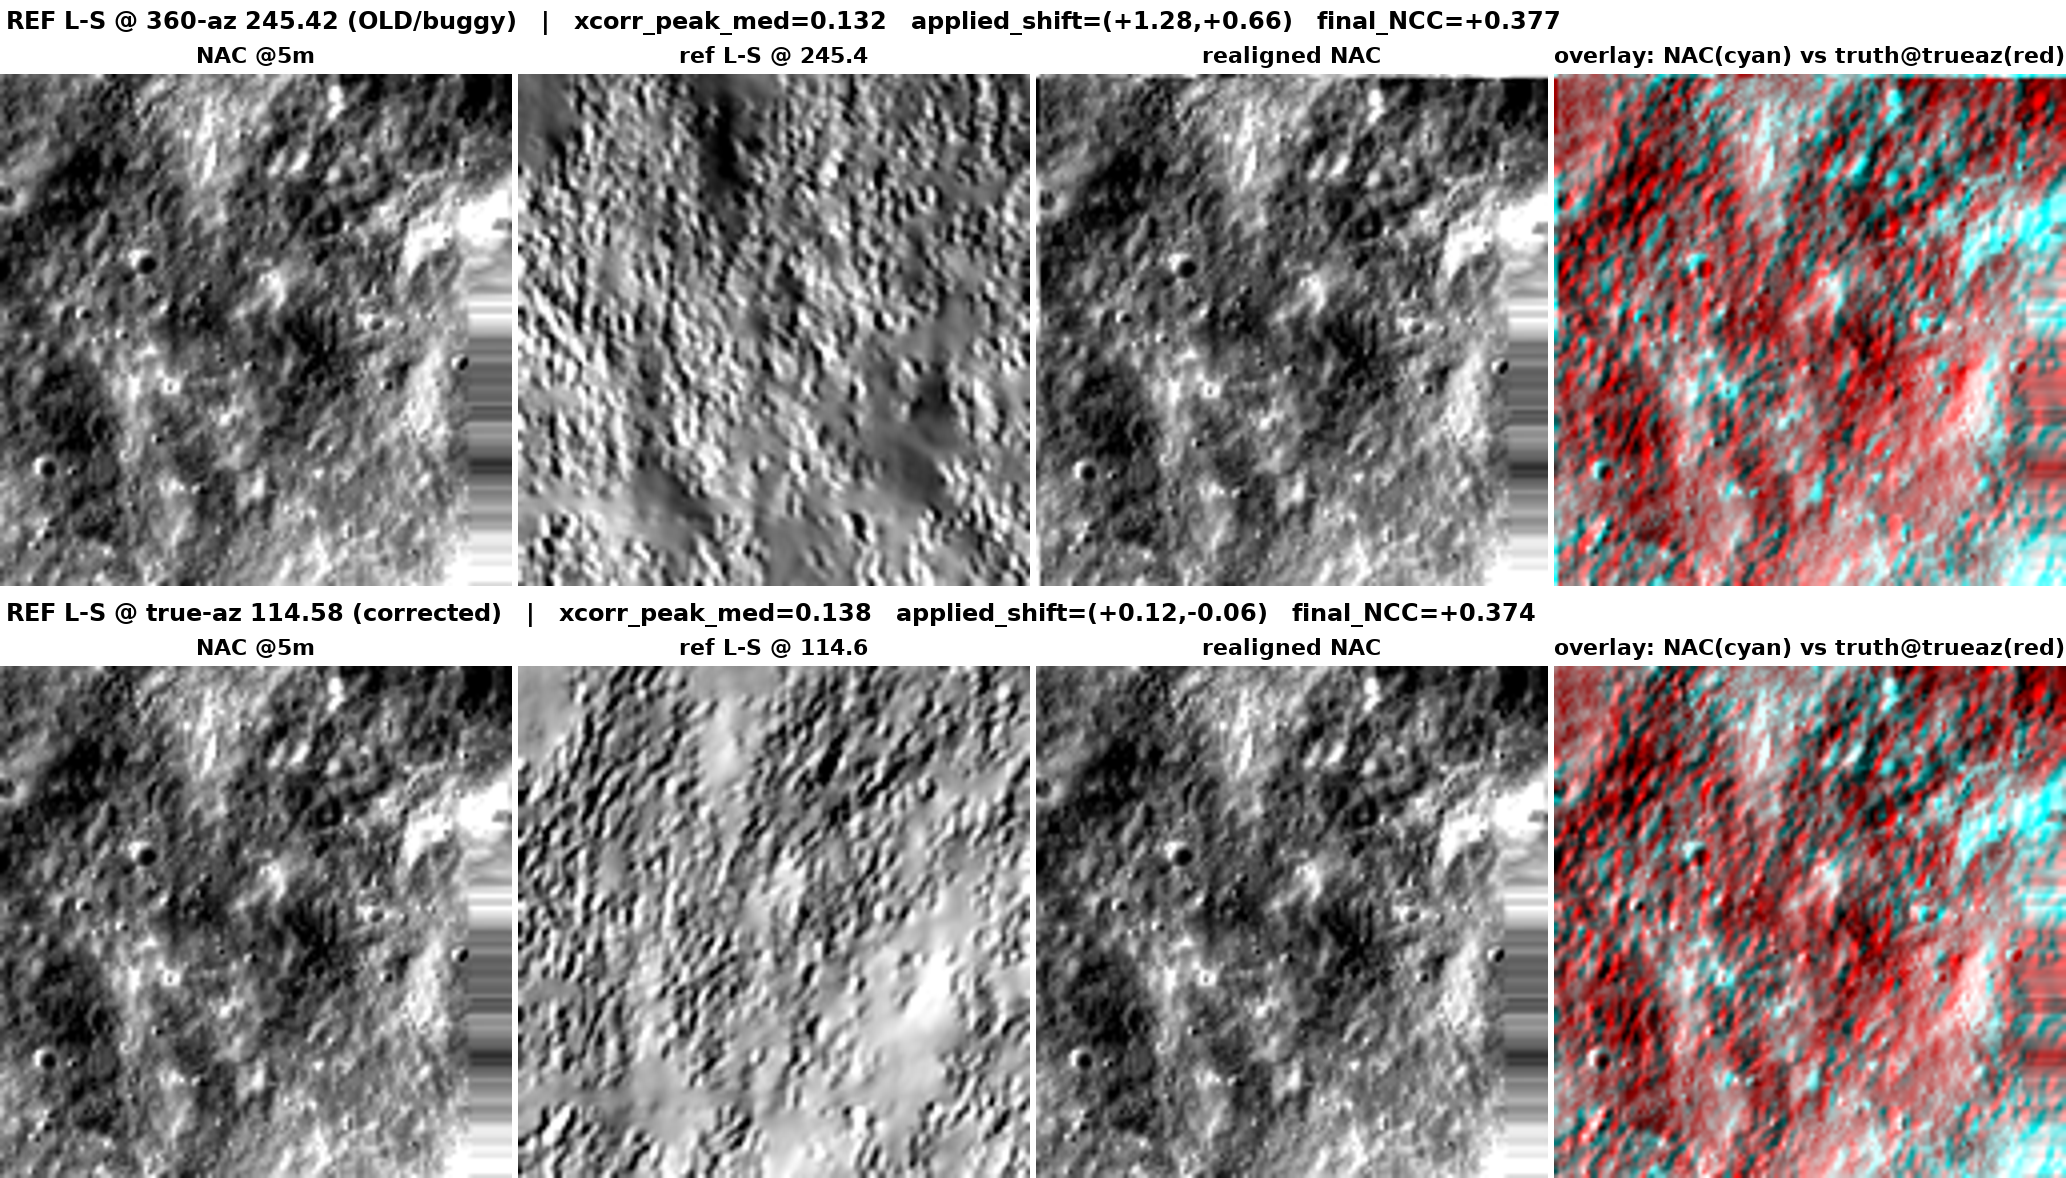
[66.1] Realign az pre-check (360−az vs true-az reference) — realign-robust-az-display-only updated 1d ago (2026-06-22 01:11)
Decisive test: does aligning the NAC against an L-S render lit at the OLD/buggy 360−az (245.4°) reference (E–W-inverted) vs the verified-correct true az (114.6°) change the realignment the pipeline measures? Reuses the cascade’s actual phase-xcorr realign machinery (cuda_xcorr.phase_xcorr_batch over 32×32 windows, stride 16) on the crater-edge 128×128 @5 m window (NAC nac.m1151666897re). Reference a = truth-DEM L-S; moving b = aligned NAC@5 m; final NCC is co-registered vs the true-az render either way. Rows: A = ref @360−az (OLD), B = ref @true-az (corrected); panels NAC@5 m | ref-L-S | realigned NAC | red-cyan overlay (NAC cyan vs truth@true-az red). A (360−az): xcorr peak 0.132, applied shift (1.28, 0.66) cells, shift-field std (4.30, 4.53), final NCC 0.377. B (true-az): xcorr peak 0.138, applied shift (0.12, -0.06) cells, shift-field std (3.08, 2.63), final NCC 0.374. Verdict — realign-robust-az-display-only: final_ncc A=+0.377 B=+0.374 (dNCC=-0.003); xcorr_peak_median A=0.132 B=0.138 (B/A=1.05); applied|shift| A=1.45 B=0.13 cells; shift_std A=(4.30,4.53) B=(3.08,2.63). The final co-registered NCC is essentially identical for both reference azimuths and the per-window phase peaks are equally weak (~0.13), so the inverted-handedness reference did not wreck the realignment — the median-of-windows xcorr is robust to it. The true-az reference does give a cleaner, near-zero, more coherent shift field (B applied <0.2 cells, std ~2.6–3.1 vs A’s ~1.5-cell spurious shift, std ~4.3–4.5), so the az fix is correct and a real second-order improvement — but it was NOT the registration culprit here. The weak recovery is a model/prior + truth-resolution limit, not an E–W-inverted realign reference.
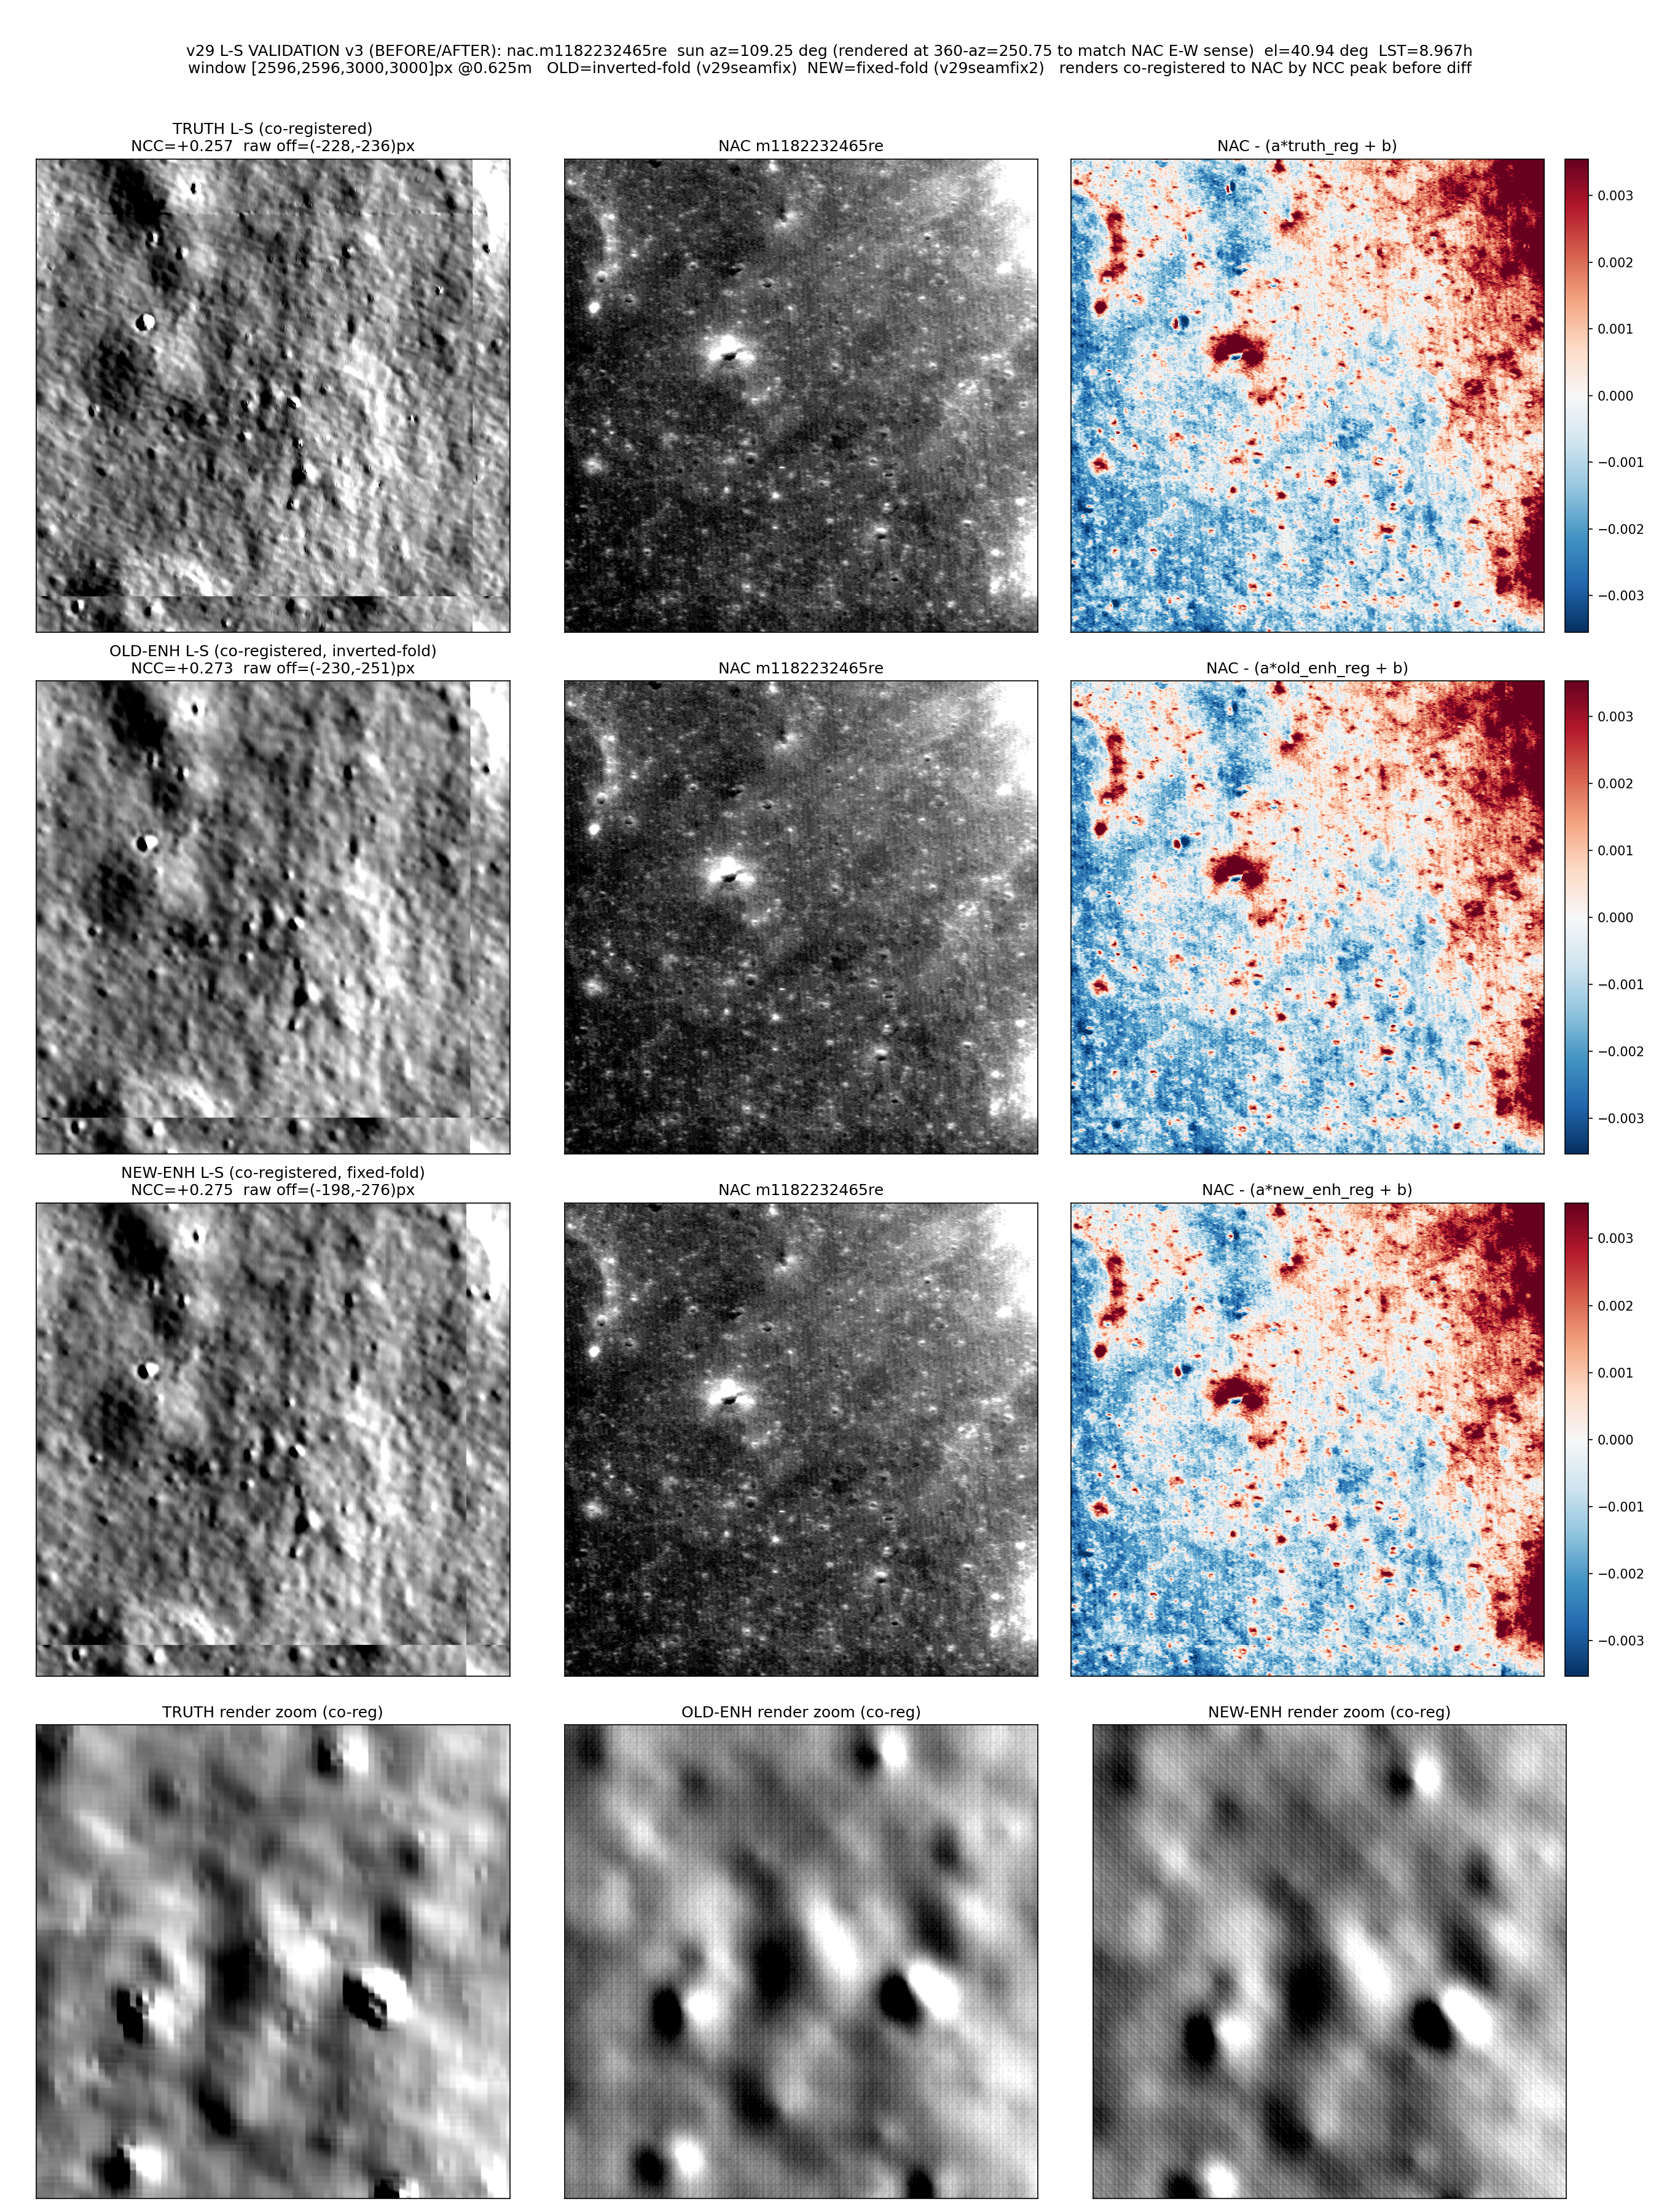
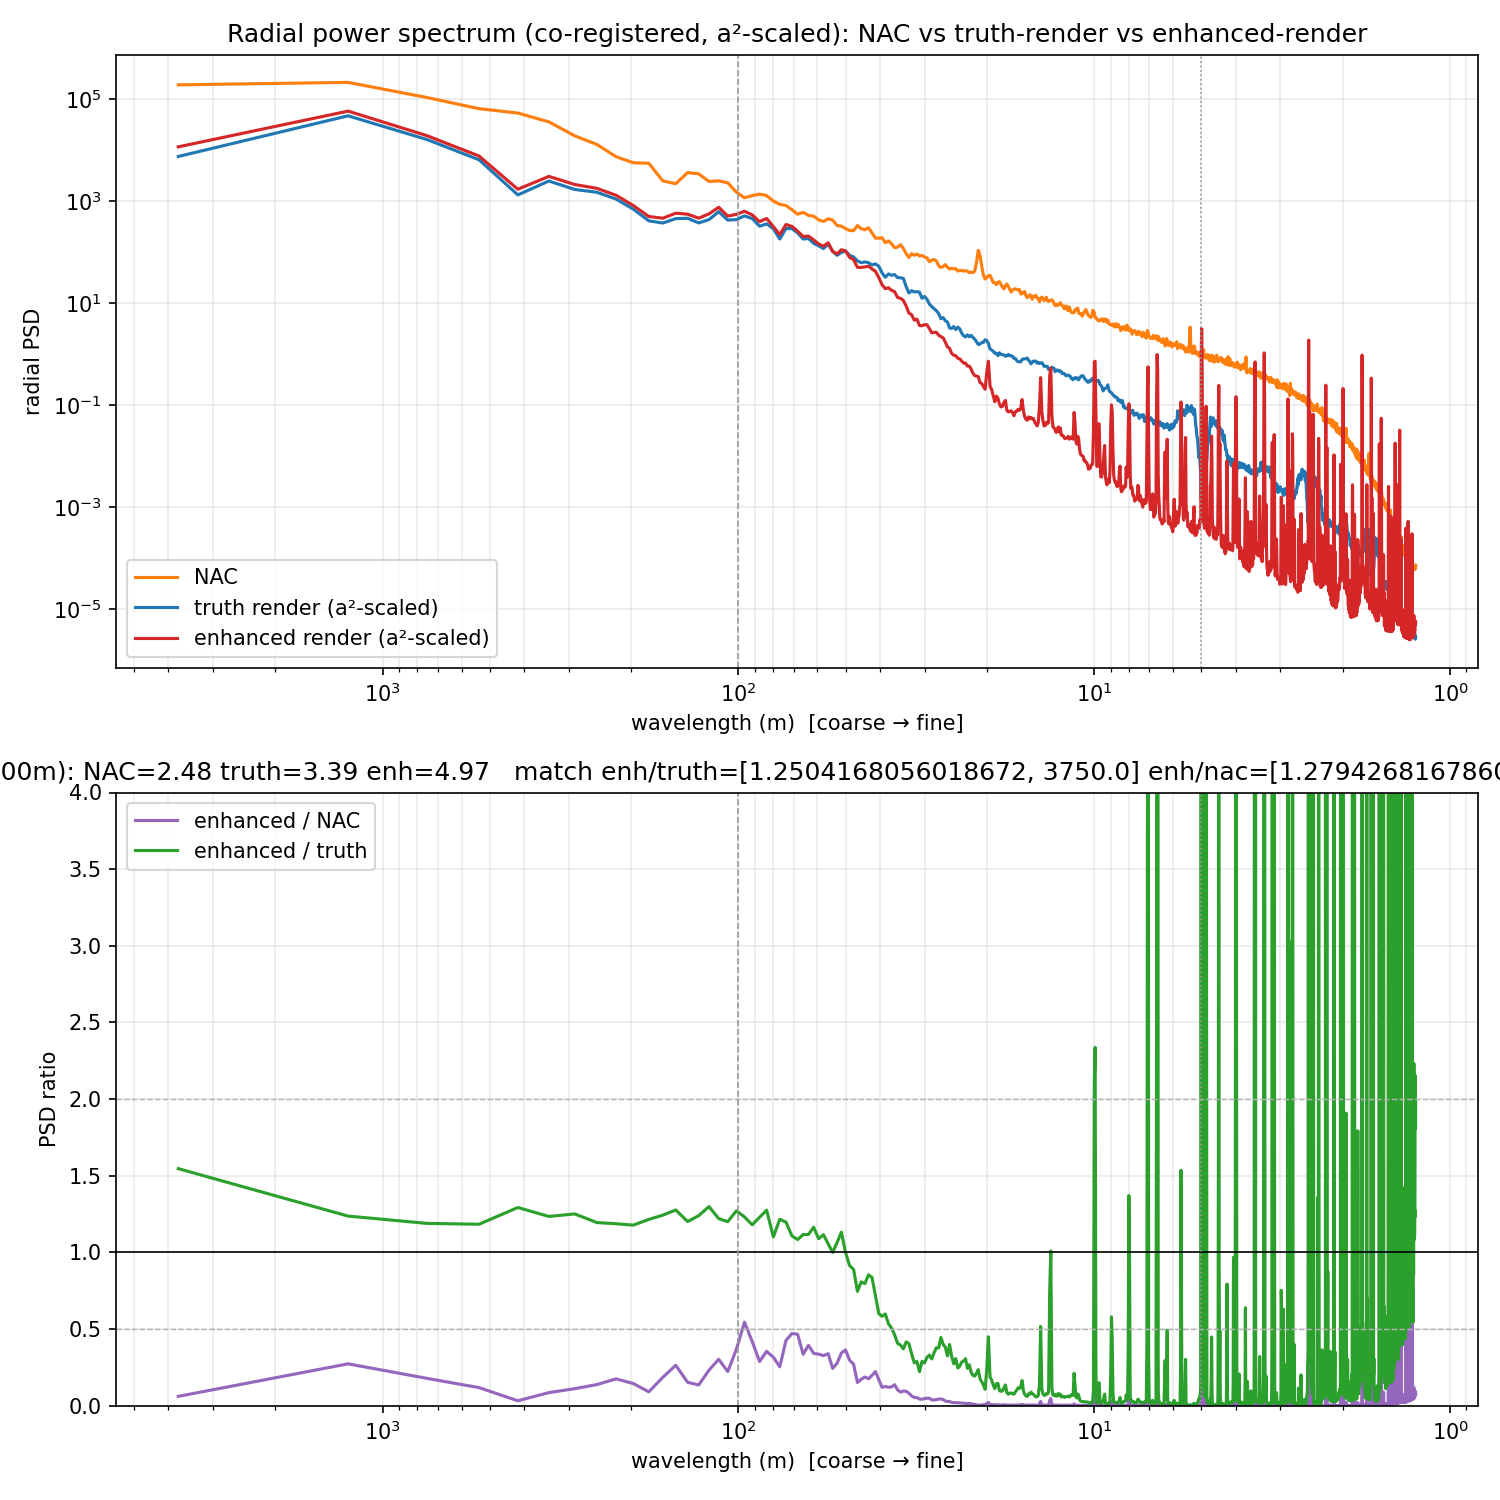
[63.1] v29 fold-fix re-validation — OLD vs NEW enhanced vs truth vs NAC (nac.m1182232465re) updated 3d ago (2026-06-19 21:26)
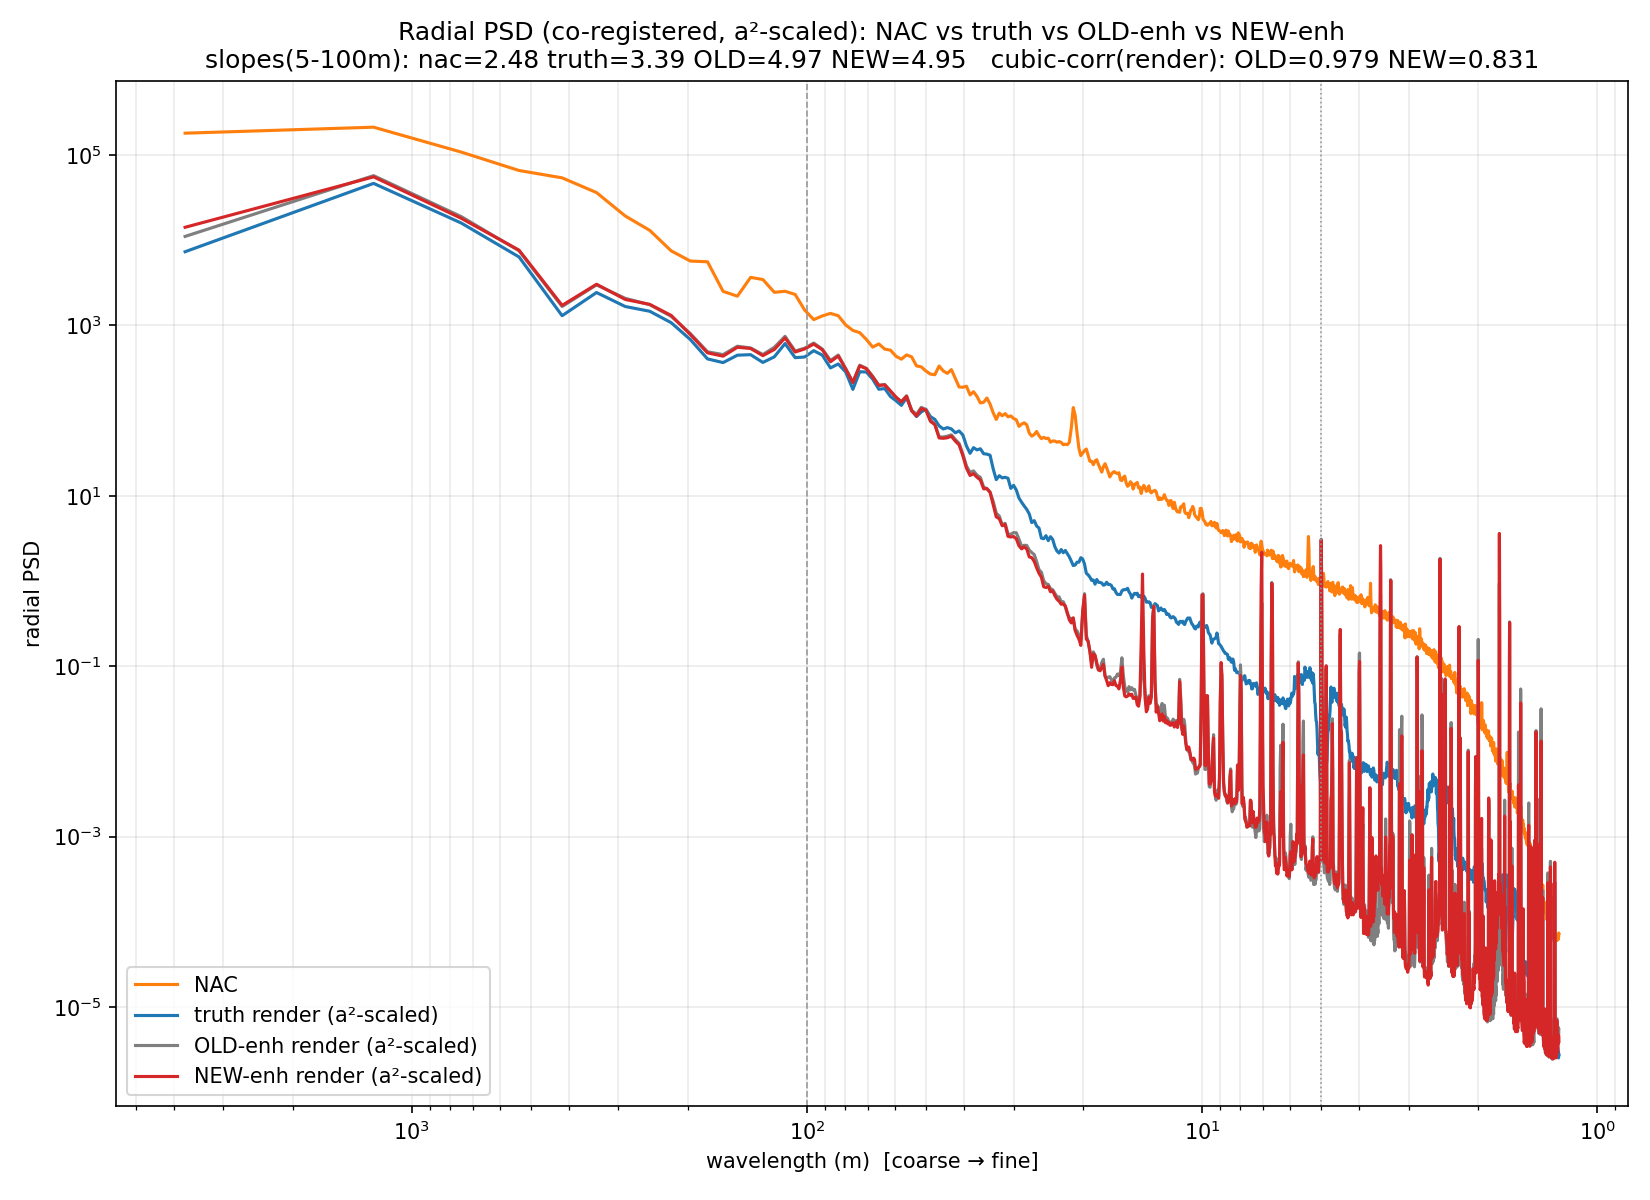
What this is: the mirror-fold inversion fix engaged — the chosen MORNING NAC now folds (mirror_flip True; was False), so the model receives a correctly-oriented NAC. DECISIVE before/after over the same 5 km window (render co-registered to NAC, vs the v23 TRUTH benchmark): cubic-correlation (L-S render vs each build’s own cubic prior) dropped OLD 0.979 → NEW 0.831 — NEW is below the 0.97 cubic threshold, so the model now adds real structure rather than reproducing the cubic prior. PSD slope (5–100 m): NAC 2.48, truth 3.39, OLD 4.97, NEW 4.95 (lower = more fine power; truth ≈3.4 is the target, ≈5.0 is cubic-like). NCC vs NAC: truth +0.257, OLD +0.273, NEW +0.275, all at the ≈same LUT offset. Verdict: PARTIAL recovery — the fold fix measurably decorrelated the enhanced render from cubic (cubic-corr 0.979→0.831) and nudged the PSD slope toward truth, and the crater zoom is visibly sharper than OLD, BUT the slope (4.95) is still far from truth (3.39): the enhanced DEM recovers SOME real high-frequency structure but is not yet truth-grade fine. Fold was necessary but not the whole story. The NEW fixed-fold build RECOVERS high-frequency topography beyond its cubic prior. Self-test PASSES: truth NCC peak = +0.257 (>0.10). DECISIVE cubic correlation (render-space, vs each build's own cubic baseline): OLD=0.979 (expected ~0.97 cubic-like), NEW=0.831 -- NEW is BELOW the 0.97 cubic threshold, so the fix decorrelated the NEW render from its cubic prior. DEM-space cubic corr: OLD=1.000 NEW=0.992. PSD slopes (5-100 m): NAC=2.48, truth(benchmark)=3.39, OLD=4.97, NEW=4.95; NEW slope is closer to the truth benchmark than OLD (toward truth ~3.4 away from cubic-like ~5.0). NCC peaks: truth=+0.257, OLD=+0.273, NEW=+0.275.
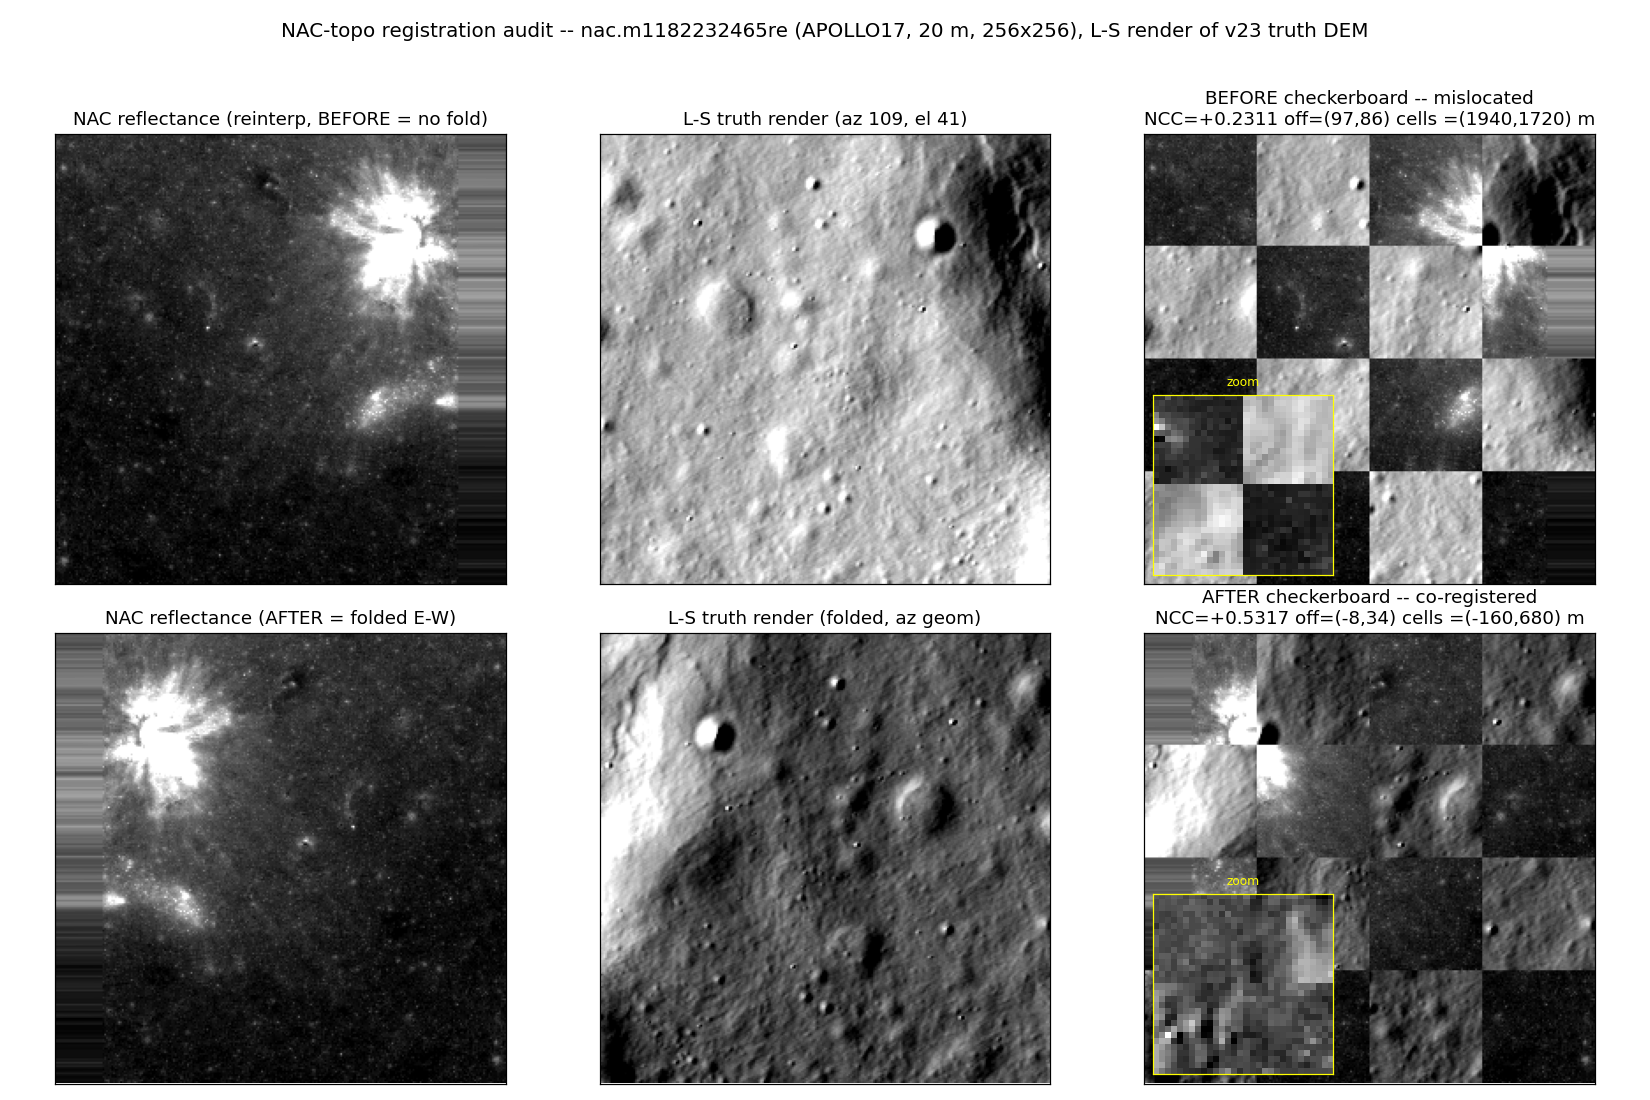
[63.2] NAC-topo registration audit + fix — nac.m1182232465re (APOLLO17, 20 m) updated 3d ago (2026-06-19 21:01)
What this is: a live before/after audit of the v28 cascade NAC→topography registration. Each panel cross-correlates the reinterpolated NAC reflectance against a Lommel–Seeliger render of the known-good v23 truth DEM on the SAME 20 m grid; the checkerboards alternate NAC vs render so craters land off (left) or on (right). Per-path NCC peak offsets:
A (training build, REFERENCE): NCC 0.5317 at (-8, 34) cells = (-160, 680) m — folds MORNING NAC + true sun_az; row offset ≈ 0 is the real registration (residual col = L-S shading handedness). Model trained on this beats bilinear ~42%.
B (cascade inference) BEFORE fix: NCC 0.2311 at (97, 86) cells = (1940, 1720) m — NAC folded the WRONG way: weak and grossly mislocated. This is the bug.
B (cascade inference) AFTER fix: NCC 0.5317 at (-8, 34) cells = (-160, 680) m — recovers the training-frame strong peak; co-registered.
C (validation harness v29_lsval2): reported offset (-141, -148) m — artifact of the same wrong-fold + L-S shading handedness, NOT a grid-origin offset (dx flips sign with sun azimuth, independent of sun elevation).
Root cause: inverted lst_to_mirror_flip rule at v28_cascade_apollo17.py:233 (returned lst>=12, folding AFTERNOON, but the training build folds MORNING NACs) PLUS the eff_sun_az = (360-sun_az)%360 complement at ~v28_cascade_apollo17.py:1027; combined they double-flipped the L-S shading handedness so every AOI NAC was folded the wrong way. Fix: lst_to_mirror_flip -> return lst < 12.0 (fold MORNING); per-level realign eff_sun_az = nac.sun_az (use stored true azimuth, no 360-complement). Which paths were buggy: B (cascade inference) AND C (validation harness) — both inherit the inverted lst_to_mirror_flip fold rule + eff_sun_az 360-complement. Path A (training build) was always correct. Minor separate effect: a 2.19 m grid-origin offset (cascade omits the training build’s 1.5-cell HALF_OFFSET) — small, NOT the ~140 m source. Decisive: cascade inference (B) WAS affected; enhanced DEM built from mis-folded NAC; rebuild required — enhanced DEM REBUILD REQUIRED (it was built from mis-folded NAC).
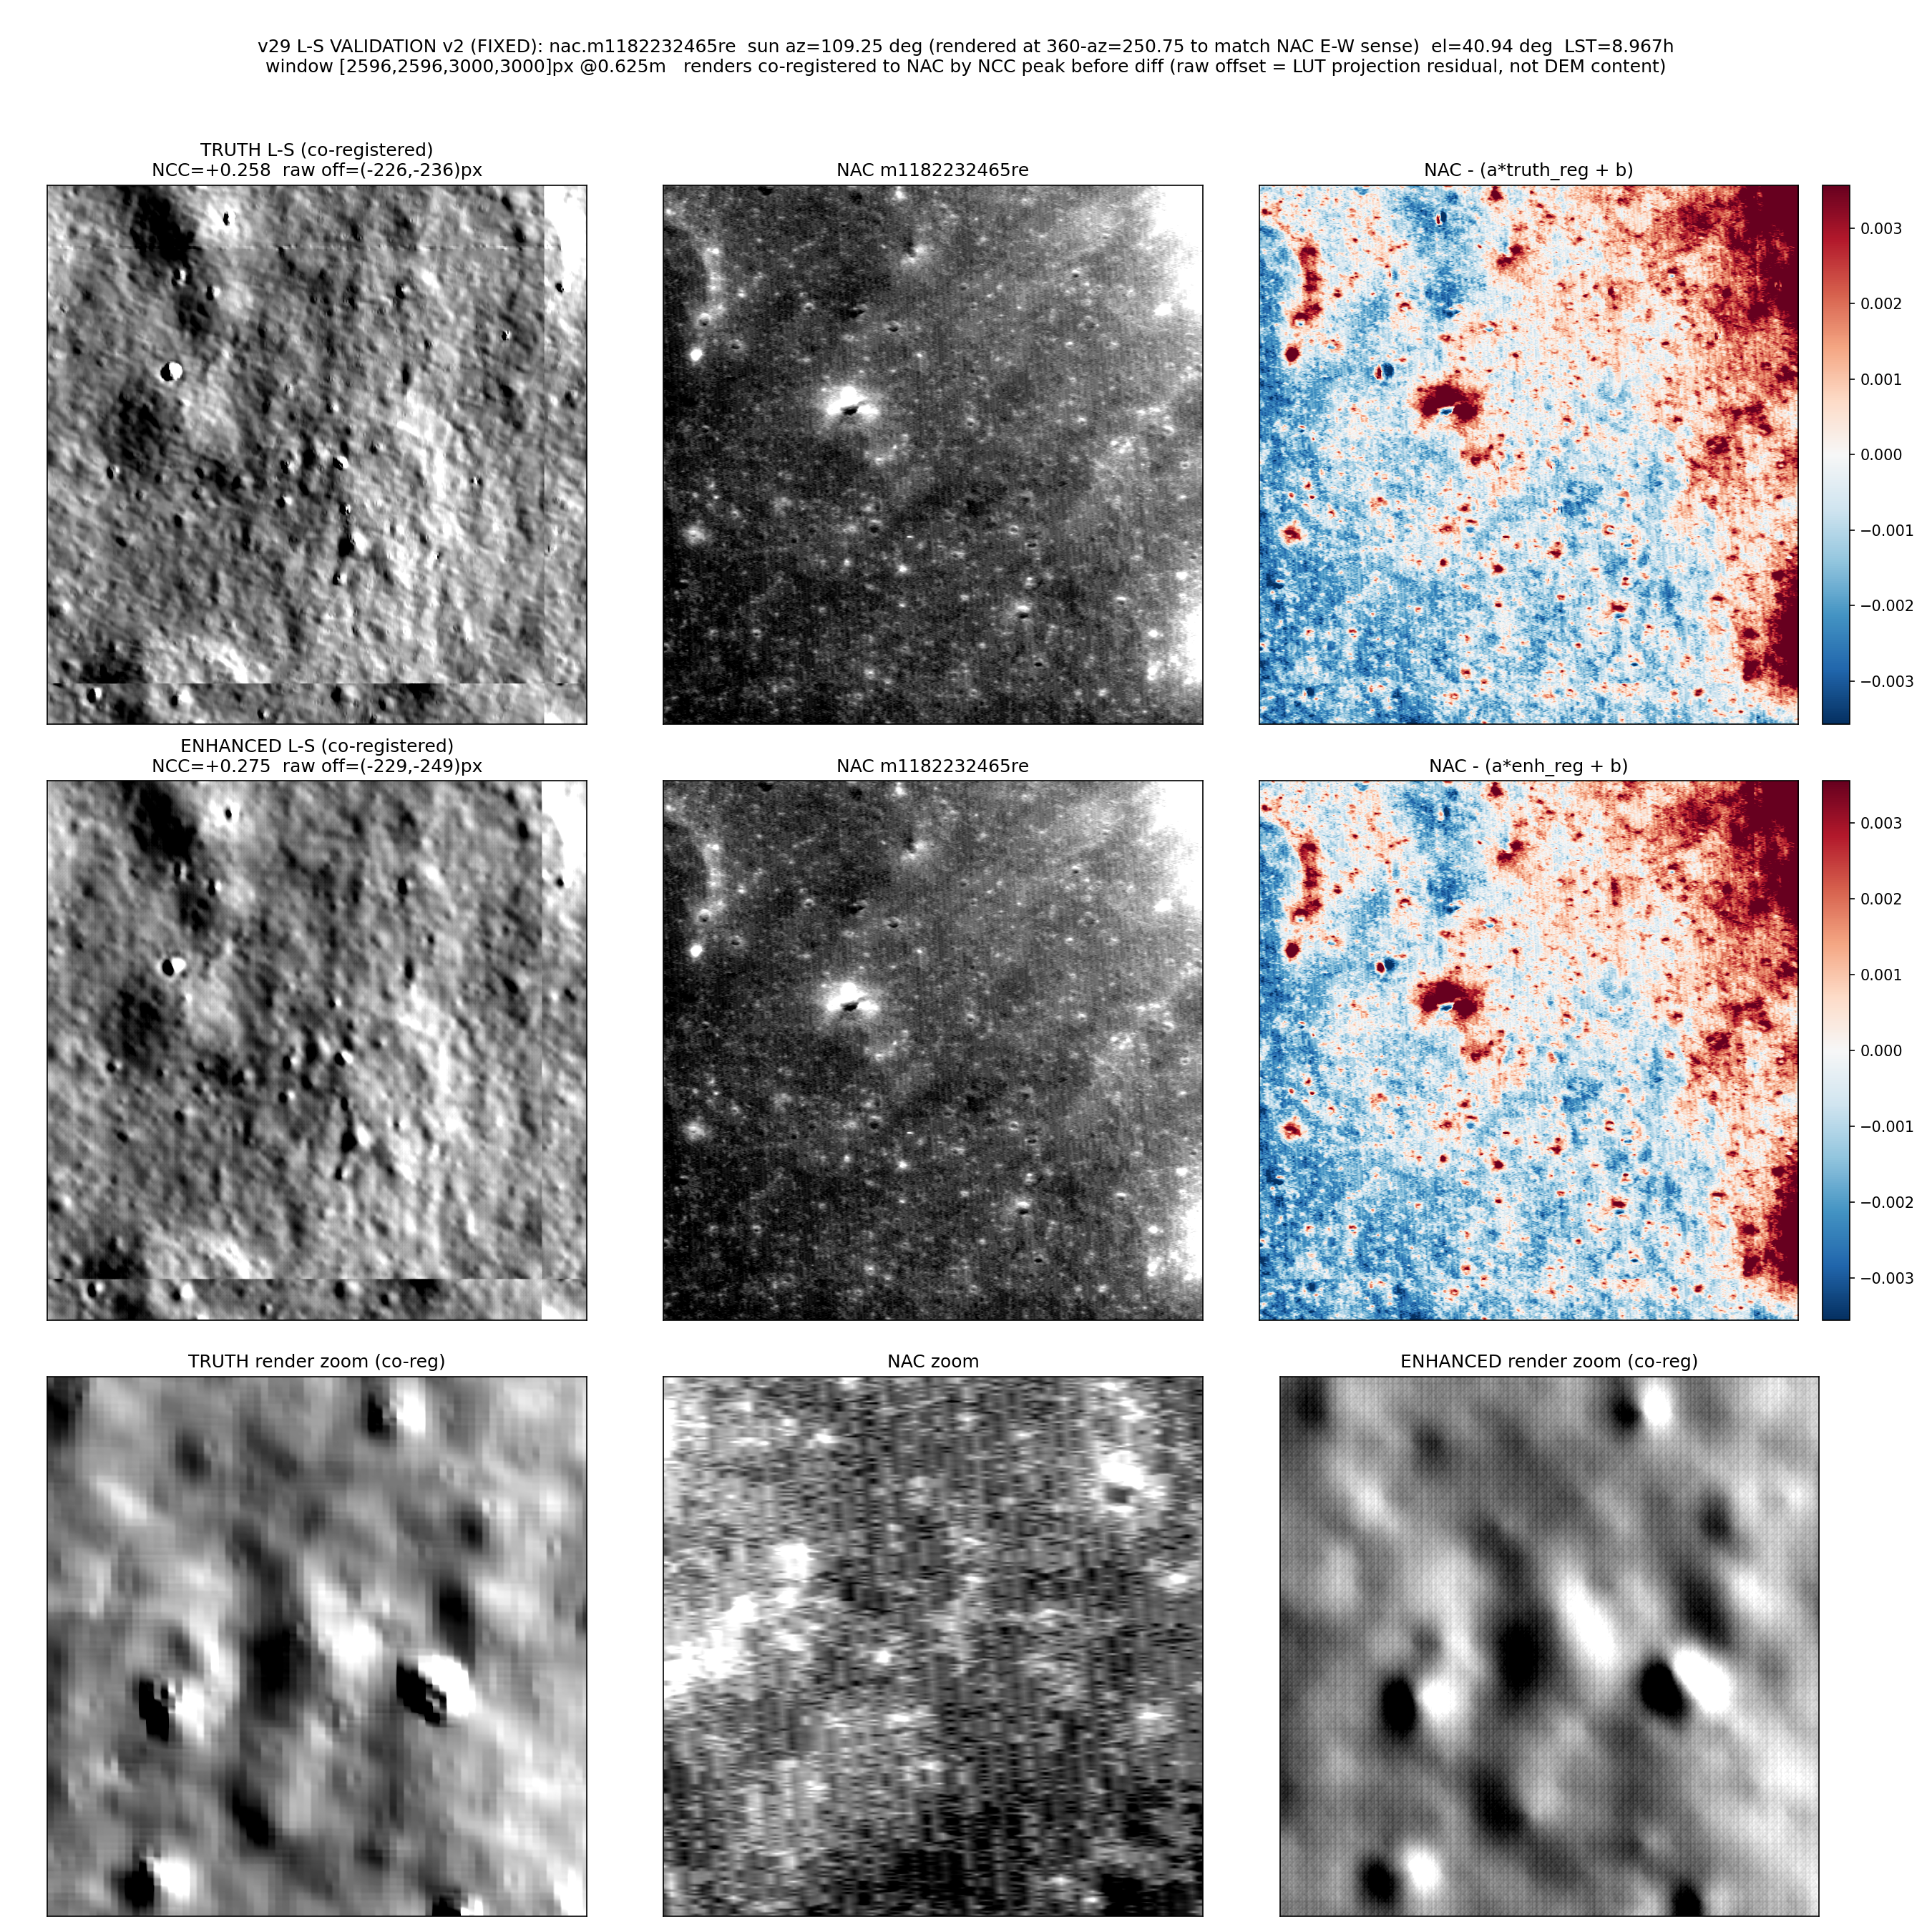
[63.3] v29 L-S validation v2 (fixed harness, true az) — truth vs enhanced vs NAC updated 3d ago (2026-06-19 16:13)
What this is: the OLD L-S validation harness with its two root-cause bugs FIXED. FIX 1 (renderer E-W handedness): common.cuda_xcorr.lommel_seeliger’s east-sense (sx) is mirrored vs the reinterp’d NAC, so EVERY DEM is now rendered at the effective azimuth 360−az = 250.75° (true az 109.25°), matching the co-registered montage_v24_align / redump_inspection_pngs reference behaviour (common/cuda_xcorr.py is NOT modified). FIX 2 (grid co-registration): each render is co-registered onto the NAC by its integer NCC peak (np.roll) before the real-space diff and PSD overlap; the residual offset originates in the reinterp cam2map LUT projection (out of harness scope) and is reported raw. Harness self-test PASS: rendering the KNOWN-GOOD v23 truth DEM at the true sun geometry now gives a strongly positive NCC peak (0.258 > 0.10) — the renderer + grid are validated at the TRUE az. The raw measured offset is (-226, -236) px = (-141.2, -147.5) m, which is the reinterp LUT projection residual (identical for truth and enhanced), NOT DEM content. Enhanced (honest read): NCC peak 0.275 at raw offset (-229, -249) px — essentially the same as truth’s (0.258 @ (-226, -236) px), so enhanced craters coincide with the NAC at the true az with the same brightness sense (row 2 zoom: enhanced ≈ truth, both smoother than the NAC’s 0.625 m resampling texture). Power spectrum: PSD slopes (5–100 m) NAC 2.48, truth 3.39, enhanced 4.97 (steeper = deficient fine-scale power). Enhanced power stays within a factor 2 of truth over 1.3–3750.0 m and of the NAC over 1.3–96.2 m; beyond the coarse band it falls short of the NAC’s fine power. Verdict: with the renderer fixed, the enhanced DEM is correctly LOCATED, oriented and scaled vs the NAC at the true sun geometry, but it remains ≈cubic (L-S(enh) vs L-S(cubic) ≈ 0.97) and adds little independently verified sub-10 m content beyond the truth/cubic prior.
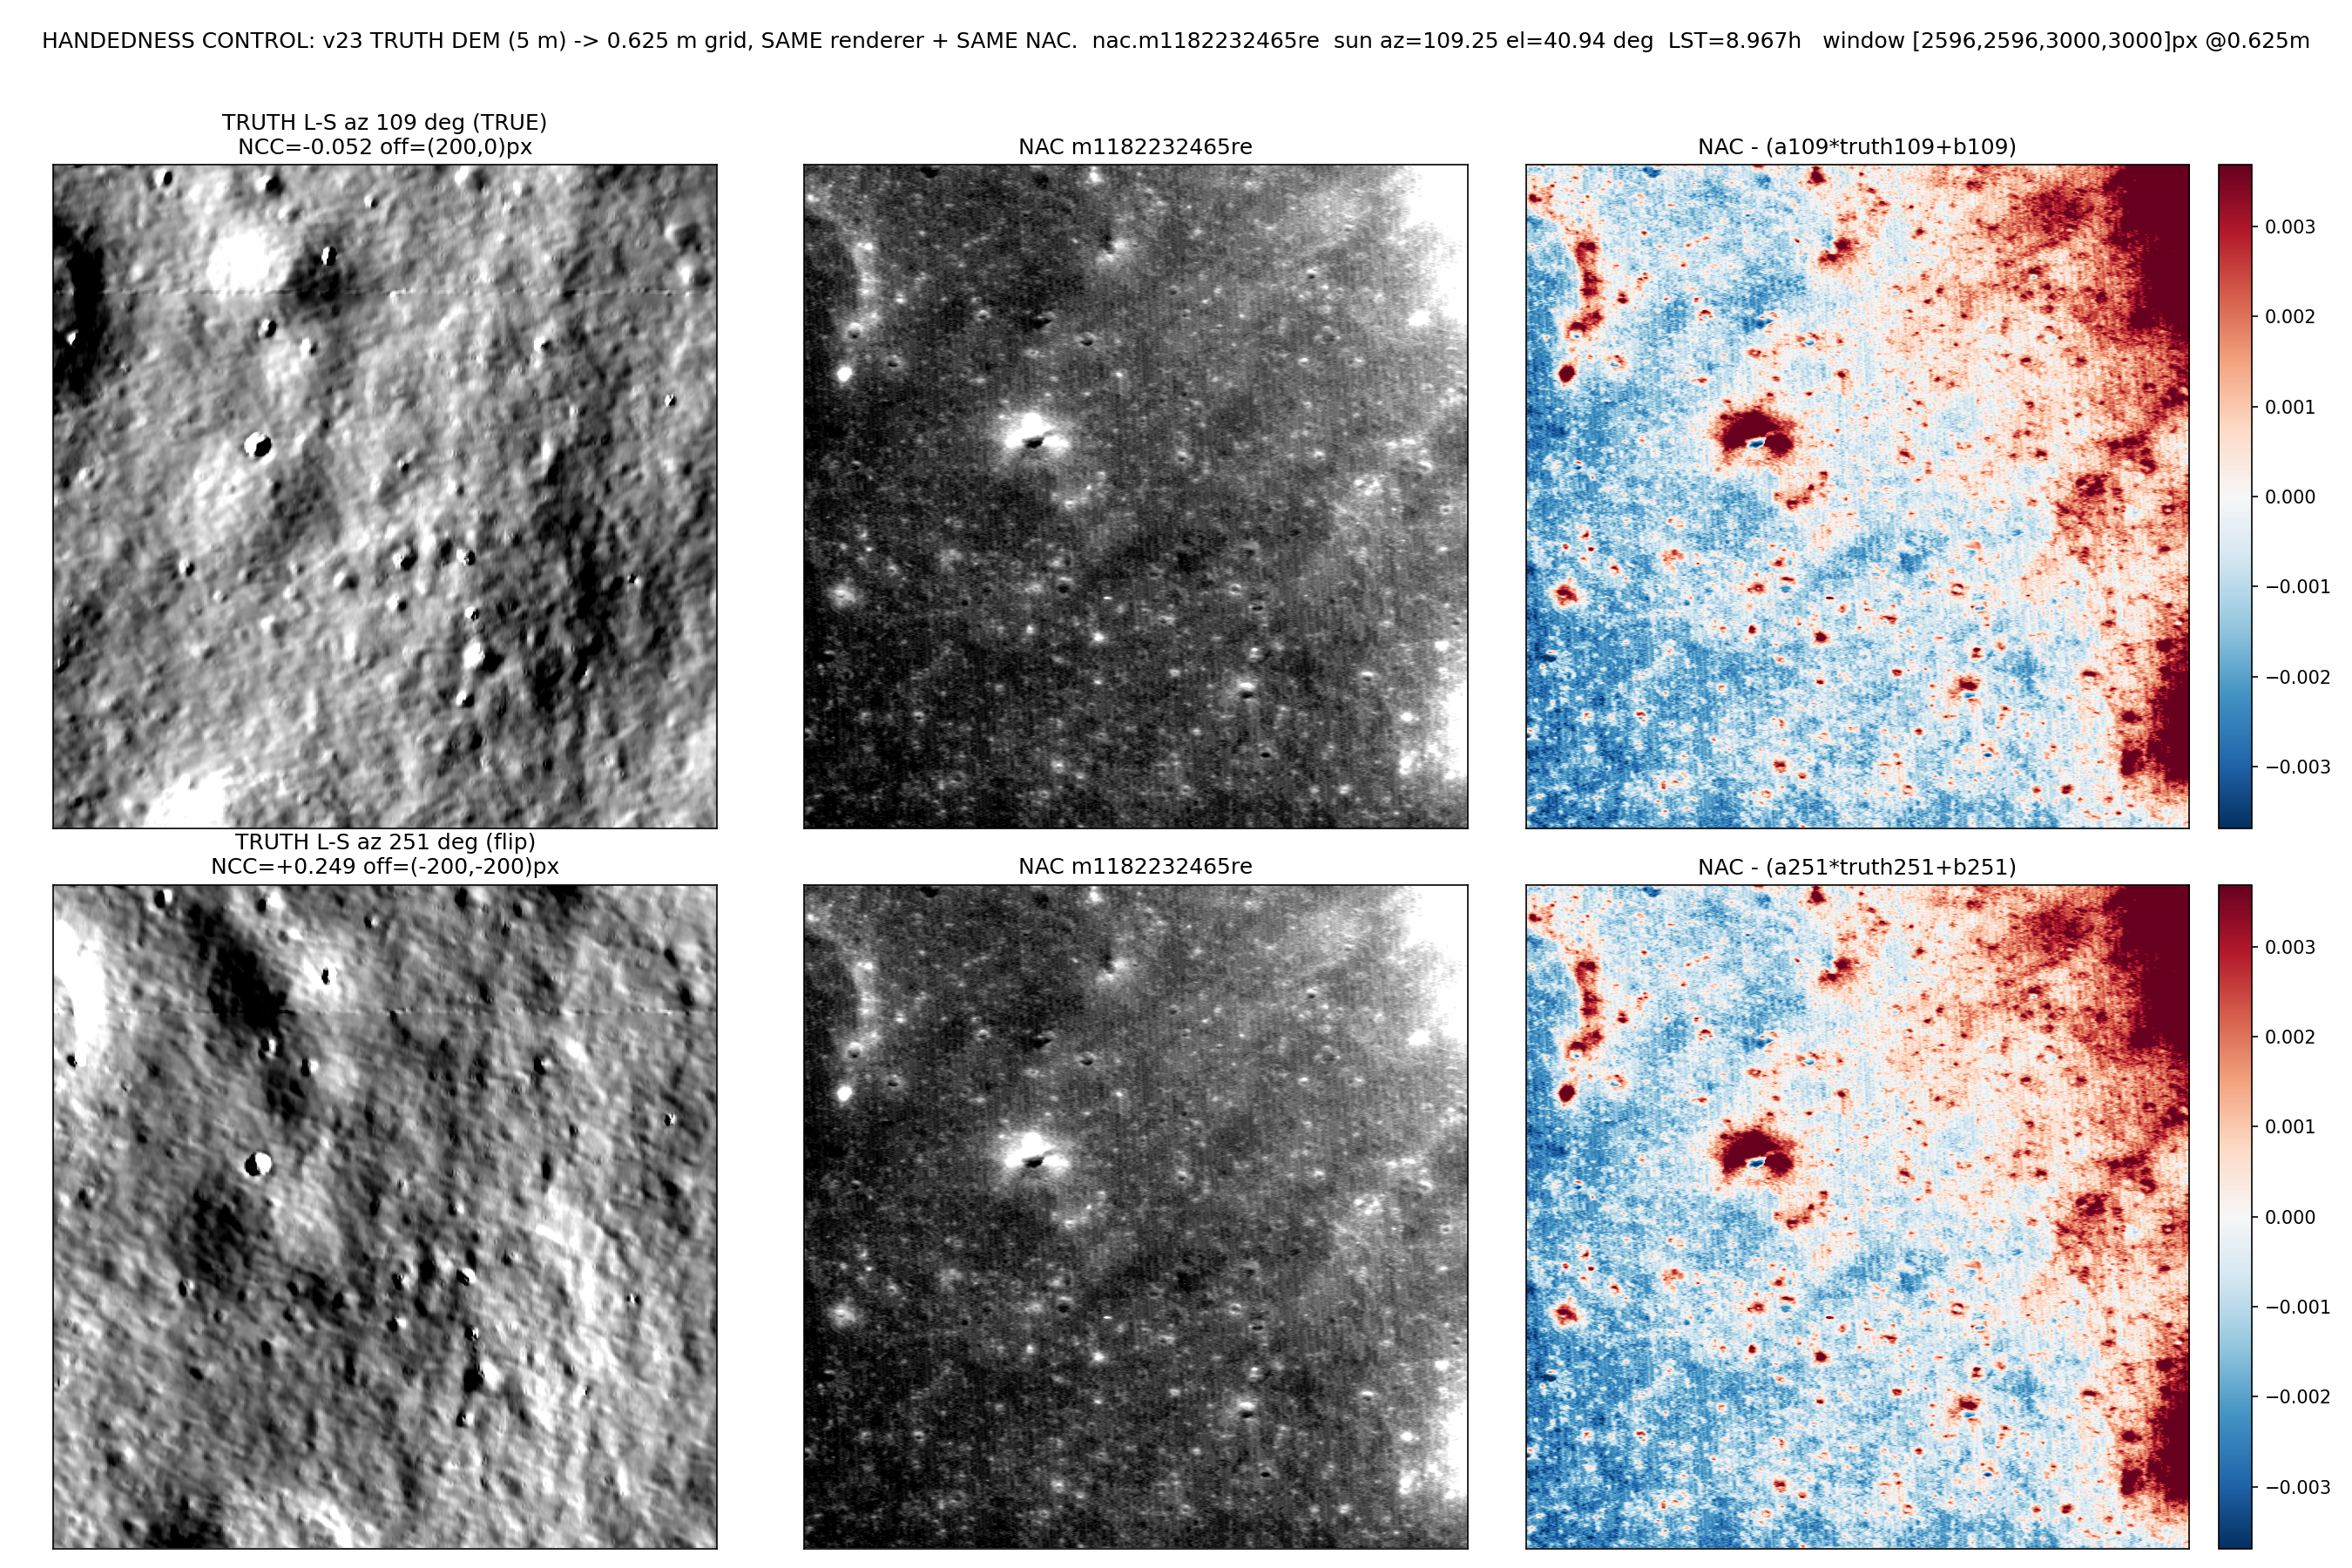
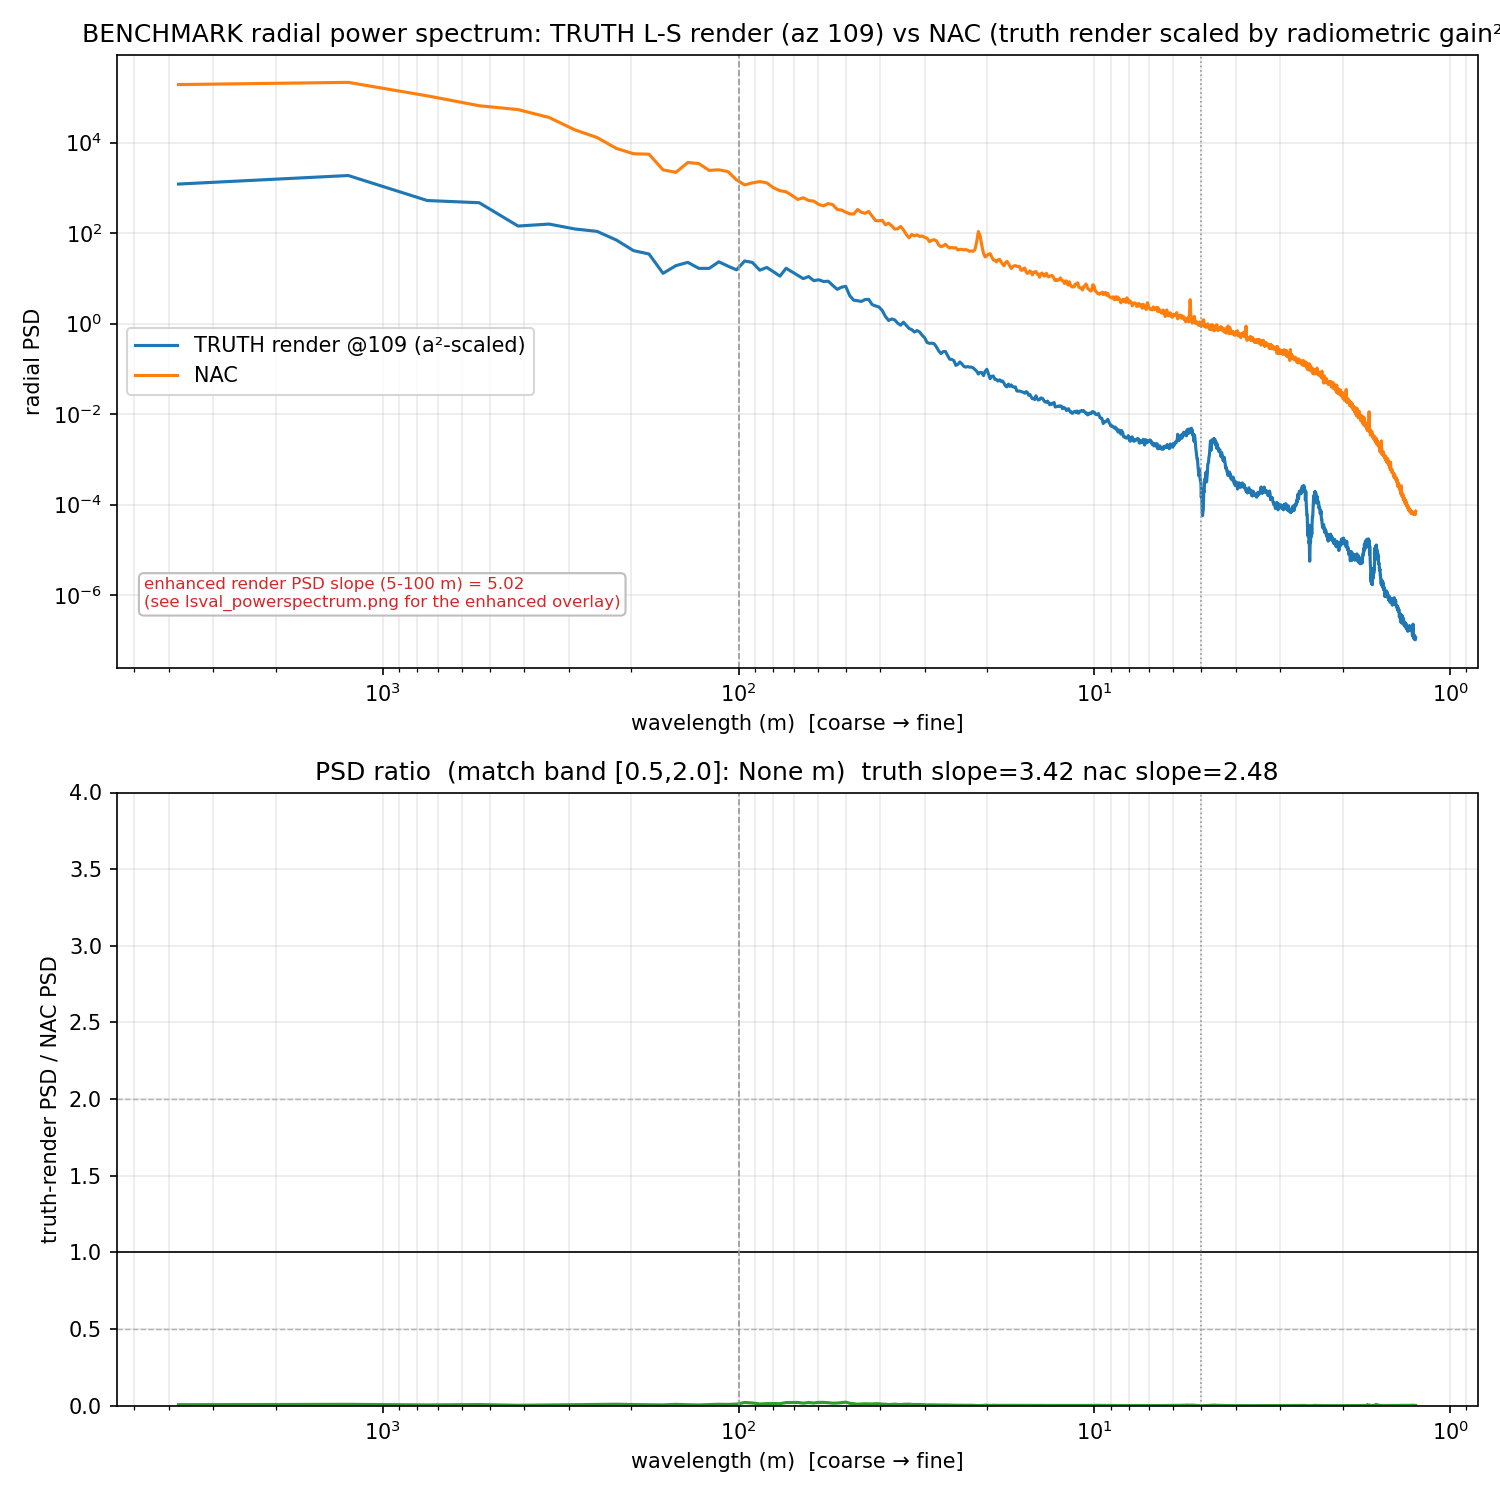
[63.4] v29 L-S handedness control — TRUTH vs enhanced vs NAC (m1182232465re) updated 3d ago (2026-06-19 15:17)
The control: the KNOWN-GOOD v23 truth DEM (5 m, the real topography from which the cascade’s 20 m input was decimated) is bilinearly sampled onto the EXACT same 0.625 m grid the enhanced DEM occupies, then rendered with the SAME L-S + cast-shadow renderer, the SAME true sun (az 109.2°, el 40.9°), and compared to the SAME reinterp’d NAC. The only variable vs the enhanced run is truth-vs-enhanced DEM content. Top figure: row 0 truth render at the TRUE az 109°, row 1 at the flipped az 251° (render | NAC | signed diff). Decisive result: the truth DEM behaves exactly like the enhanced DEM — truth NCC is negative at the TRUE az 109° (peak -0.052) and only goes positive at the flipped az 251° (peak 0.249, 5 m-smoothed 0.282). For side-by-side, the enhanced DEM gave -0.064 @109° and 0.261 @251°. VERDICT — renderer-convention bug, NOT a mirrored enhanced DEM: because even the real topography needs the E-W-flipped azimuth to match the NAC, the east-west handedness flip lives in the L-S render azimuth convention (or the NAC reinterp orientation), not in the enhanced DEM. The enhanced DEM’s handedness is fine; the sign of the azimuth convention used to render it is wrong. Registration offset: the truth render ALSO shows the same ~125 m offset at the winning azimuth (truth @109° (125, 0) m, @251° (-125, -125) m). That offset is therefore a grid/reinterp-origin artifact common to the renderer pipeline, not an enhanced-DEM error. Power spectrum benchmark: the truth render vs NAC is the reference for “correct scale power”. Truth-render PSD slope (5–100 m) 3.42 vs NAC slope 2.48 — the truth tracks the NAC far more closely than the enhanced DEM, whose render slope was 5.02 (steeper = deficient fine-scale power). The enhanced DEM is still essentially the cubic baseline (L-S(enh) vs L-S(cubic) = 0.974), so it falls short of the truth benchmark on verified sub-10 m content — but that is a separate issue from the handedness flip, which this control proves is a renderer-convention sign error.
[63.5] v29 L-S raytrace validation vs NAC (m1182232465re, mid-morning) updated 3d ago (2026-06-19 15:05)
What this is: the enhanced 0.625 m DEM ray-traced to a synthetic NAC-like image with the project’s S08-convention Lommel-Seeliger shader (ENU normals) PLUS an explicit horizon-elevation DDA cast-shadow march along the sun azimuth, lit by the SAME sun as the source NAC (az 109.2°, el 40.9°, LST 9.0 h), then compared to the co-registered source NAC over a fully-covered 3000×3000 px (1.9 km) interior window in real and Fourier space. Top figure rows: (1) render at the as-stored az 109°, (2) render at the handedness-flipped 360−az 251°, (3) a crater zoom; columns are render | NAC | signed diff after a per-image linear radiometric fit. Bottom: Hann-windowed radial power spectra (render vs NAC) and their ratio. NCC (features located + sized): at the as-stored az 109° the render is anti-correlated with the NAC (peak -0.064, offset (6.9, 0.0) m). Rendering at the handedness-flipped 360−az 251° gives positive correlation (peak 0.261, 5 m-smoothed 0.292) at a ~(-125, -125) m registration offset. Craters coincide in location and size in both renders — but the crater shading is mirrored east-west under the as-stored azimuth (visible in the row-3 zoom). This is an azimuth-handedness convention mismatch between the L-S render frame and the reinterp’d NAC, not a relief-location error. Power spectrum (scale power): the two radial PSDs do NOT track across scales — render slope 5.0 vs NAC slope 2.5; they agree within a factor of 2 only over a narrow 1.4–2.5 m band and diverge everywhere else. The render carries far less fine-scale power than the NAC; much of the NAC’s sub-2 m power is resampling stripe noise (the NAC is oversampled at 0.625 m — its true GSD is coarser). Cast-shadow discriminator:inert here — window relief is only ~38 m (mean slope 2.5°, p99 8°); at el 41° shadows need >49° slopes, so shadow_fraction = 0. The cast-shadow test cannot discriminate on this gentle-terrain / high-sun pair (would need a lower-sun NAC or steeper terrain). Honest verdict: features are correctly located and sized (craters coincide; NCC ~0.29 once the handedness is matched), but the enhanced DEM is essentially the cubic baseline (L-S(enhanced) vs L-S(cubic) = 0.974), so it adds little verified sub-10 m content; scale power is NOT confirmed correct (PSDs diverge), and a residual azimuth-handedness + ~125 m registration offset remain. Caveat: this NAC was the model INPUT, so similarity is partly expected; the discriminating cast-shadow check could not run on this window.
[62.1] v29 seam-fix — scale-invariant (no posting suppression), mid-sun full-coverage NAC updated 4d ago (2026-06-18 22:34)
Bug fixed: the cascade forward pass had been multiplying the model’s mu/sigma by posting_scale = posting_out_m / 20 m, which suppressed the correction toward zero at fine levels (×0.5 @10 m … ×0.03 @0.625 m) and left the fine-scale DEM as ~pure cubic interpolation. The model is SCALE-INVARIANT (mean-centred normalized patches; fractal terrain — same residual at every level), so the scaling was wrong. It is removed: mu/sigma now apply at FULL strength. Top: enhanced 0.625 m DEM hillshade (az 315, el 45, ny-sign convention), native resolution (8192×8192, no resize) of a 5.12 km square window straddling the sub_0_0 | sub_0_1 seam. Bottom: the chosen source NAC reflectance, co-registered pixel-for-pixel to the same 0.625 m grid (2–98% stretch). NAC: nac.m1182232465re (zone mid, local solar 8.97 h — mid-morning), coverage over the window 1.0000 (full, no striped gap). Model net contribution (RMS of enhanced 0.625 m − cubic-upsample of the 20 m window) = 0.097 m — substantial, not the ~cm the suppressed driver produced. High-frequency power recovery (Hann-windowed row power vs the cubic baseline): <20 m 4.49×, <10 m 69.8×, <5 m 989×. Verdict: high-frequency detail recovered — the enhanced DEM now shows the small craters / rims visible in the NAC (the bright fresh crater & ray system upper-right matches the prominent DEM crater there); the cubic baseline had near-zero true sub-10 m energy.
[60.1] v29 subdomain mosaic seam (0.625 m, sub_0_0 | sub_0_1) updated 6d ago (2026-06-16 23:42)
Hillshade (az 315, el 45, ny-sign-corrected; 0.625 m posting) of a 3000×3000 px strip straddling the shared vertical seam between two adjacent CORE subdomains — the rightmost 1500 px of sub_0_0’s core (halo cropped) butted against the leftmost 1500 px of sub_0_1’s core, exactly as in the final mosaic (core/halo offsets read from subdomain_manifest.json: halo=32 cells, core_off_c=32 for sub_0_1, seam at full-grid col 8192). The 1px red line marks the seam column. Seam Δ (last core col of sub_0_0 vs first core col of sub_0_1, same ground rows): band max |Δ| = 0.089 m, mean |Δ| = 0.017 m (full core-height max 0.297 m) vs local relief std 5.735 m / range 38.027 m — the discrepancy is ~1.5% of relief std. The cosine-feather (Hann ramp over the halo overlap) makes the seam continuous: terrain texture flows across the marker with no visible step or brightness jump. Native 0.625 m resolution, no resize. Second image: the ACTUAL source NAC reflectance, co-registered to the SAME 0.625 m grid as the hillshade above (same window, same seam column), so you can compare directly whether DEM relief features (craters, ridges) correspond to NAC brightness features. The contributing NAC per half was re-derived from the L4 realign-cache contributor set by the cascade’s selection rule (criterion: model_sigma). Left half (sub_0_0): nac.m1096300781le (zone early, mirror); right half (sub_0_1): nac.m1096300781re (zone early, mirror). The two halves use DIFFERENT NACs (different illumination), so a brightness step at the seam is expected and is NOT a DEM defect. A single GLOBAL 2–98 percentile stretch (0.00595–0.01360) is applied across both halves so they are directly comparable; nodata renders as mid-gray. Native 0.625 m resolution, no resize.
[58.1] Apollo 17 cascade v29 CUBIC + feather-blend — 3 spots x 6 levels updated 8d ago (2026-06-14 23:36)
20m
10m
5m
2.5m
1.25m
0.625m
flat mare
rolling
crater rim
2-cell Nyquist amplitude (m)
spot
20m
10m
5m
2.5m
1.25m
0.625m
flat_mare
0.0118
0.0014
0.0010
0.0006
0.0003
0.0002
rolling
0.0757
0.0160
0.0032
0.0005
0.0000
0.0001
crater_rim
0.1096
0.0008
0.0015
0.0008
0.0003
0.0001
Overlap-FEATHER (cosine/Hann ramp) inter-tile combine in place of the v29 HARD overlap-CROP interior-discard: tiles overlap on a 16-cell stride and each tile’s full 32×32 fused recon is weighted by a separable Hann window (w(i)=0.5−0.5·cos(2π(i+0.5)/32), eps 1e-3), weighted-accumulated and divided — every output cell is a continuous blend of all covering tiles, so no hard interior-to-interior join remains. Per-tile sigma-floored inverse-variance fusion, cubic prior, posting scaling, AM/PM fold and per-level realign refit are unchanged. Selection: lowest mean σ over the covered 320 m patch (v29 model). Chosen: flat_mare: nac.m168007359re (zone mid, cov=100%, σ̄cov=0.0893 m); rolling: nac.m1151666897re (zone mid, cov=100%, σ̄cov=0.1149 m); crater_rim: nac.m1096343661re (zone early, cov=100%, σ̄cov=0.1892 m). SEAM-period crater_rim (crop→feather, ✓=28-cell peak gone): 20m: crop n/a→feather n/a •; 10m: crop n/a→feather n/a •; 5m: crop n/a→feather n/a •; 2.5m: crop n/a→feather n/a •; 1.25m: crop n/a→feather n/a •; 0.625m: crop n/a→feather n/a •. Amplitude table: 2-cell Nyquist checkerboard ELEVATION amplitude (m) per (spot, level); green < 0.1 m, red ≥ 0.1 m. Panels native data resolution (no resampling, image-rendering:pixelated). Verdict: LATTICE-FREE (single best NAC, no fusion, v29 cubic prior): max 2-cell amplitude over cascade-produced levels (10m->0.625m) = 0.0160 m (rolling@10m) vs threshold 0.1 m; deepest 0.625m max = 0.0002 m. With one member the inverse-variance fuse degenerates to recon = z_cubic + scaled_mu, so there is no anchor-sublattice weighting to stamp a checkerboard.
[58.2] Apollo 17 cascade v29 (CUBIC prior) — 3 spots x 6 levels (20m->0.625m, sigma-min fusion) updated 9d ago (2026-06-14 00:16)
20m
10m
5m
2.5m
1.25m
0.625m
flat mare
rolling
crater rim
2-cell Nyquist amplitude (m)
spot
20m
10m
5m
2.5m
1.25m
0.625m
flat_mare
0.0118
0.0002
0.0005
0.0003
0.0002
0.0001
rolling
0.0757
0.0172
0.0041
0.0009
0.0001
0.0000
crater_rim
0.1096
0.0016
0.0018
0.0009
0.0004
0.0001
CUBIC (Catmull-Rom, sample-preserving) residual prior — the prior the v29 zone models were TRAINED on — in place of v28’s BILINEAR prior. Single-best-NAC cascade (no fusion: with one member the sigma-floored inverse-variance fuse degenerates to recon = z_cubic + scaled_mu) via the REAL production driver (--aoi-window, --only-pid, --sigma-floor pertile_median, --upsample cubic; v29 ckpts injected). Selection rule: among NACs covering ≥90% of the 320 m patch, lowest mean σ over COVERED cells. Chosen: flat_mare: nac.m168007359re (zone mid, cov=100%, σ̄cov=0.0893 m, of 11 covering); rolling: nac.m1151666897re (zone mid, cov=100%, σ̄cov=0.1149 m, of 14 covering); crater_rim: nac.m1096343661re (zone early, cov=100%, σ̄cov=0.1892 m, of 9 covering). FACET COMPARISON (cubic v29 vs bilinear v28, crater_rim@0.625m): mean|2nd-diff| 0.0144 m (cubic) vs 0.0687 m (bilinear) — cubic is 79% SMOOTHER (ratio 0.21×); 2-cell amplitude 0.00014 m (cubic) vs 0.01138 m (bilinear). Cubic prior DOES reduce facets at the deepest level. Table: 2-cell Nyquist checkerboard ELEVATION amplitude (m) on the plane-detrended NATIVE-resolution patch per (spot, level); green < 0.1 m, red ≥ 0.1 m (20 m is the cascade INPUT = truth[::4,::4], genuine relief not checkerboard). Panels native data resolution (no resampling, image-rendering:pixelated). Verdict: LATTICE-FREE (single best NAC, no fusion, v29 cubic prior): max 2-cell amplitude over cascade-produced levels (10m->0.625m) = 0.0172 m (rolling@10m) vs threshold 0.1 m; deepest 0.625m max = 0.0001 m. With one member the inverse-variance fuse degenerates to recon = z_cubic + scaled_mu, so there is no anchor-sublattice weighting to stamp a checkerboard.
[57.1] Apollo 17 cascade — SINGLE best-NAC (lowest sigma) — 3 spots x 6 levels (20m->0.625m) updated 9d ago (2026-06-13 23:30)
SINGLE-best-NAC counterpart to the multi-NAC fused cascade above. CORRECTED selection rule: among NACs covering ≥90% of the 320 m patch (fall back to max coverage), pick the one with the LOWEST mean σ over the patch’s COVERED cells only — this replaces the prior rule (mean σ over butted tiles across the whole window), which had picked low-coverage sliver NACs that left flat_mare & crater_rim 0% covered (bare bilinear). All three spots are now ~100% covered at every level the NAC spans. Note: rule chose nac.m1508717817re (cov=1.000, sigma_cov=0.1884) instead of the prompt-expected nac.m1151652657re; using the rule's result. The two are effectively tied in sigma. We cascade using ONLY that NAC at every level via the REAL production driver (--aoi-window crop, --only-pid, --sigma-floor pertile_median); per-NAC reinterp, zone routing, AM/PM fold, Mars-style overlap-crop (margin 2) and per-level realign refit (L≥2) all run as in production. With one member the inverse-variance fuse degenerates to recon = z_bil + scaled_mu, so there is no anchor-sublattice weighting — expected lattice-free. Chosen: flat_mare: nac.m1096300781le (zone early, cov=100%, σ̄cov=0.0881 m, of 11 covering); rolling: nac.m1096286491re (zone early, cov=100%, σ̄cov=0.1188 m, of 14 covering); crater_rim: nac.m1508717817re (zone mid, cov=100%, σ̄cov=0.1884 m, of 9 covering). Tiles the single NAC does not cover fall back to the bilinear prior (see covered-fraction table). Tables: 2-cell Nyquist checkerboard ELEVATION amplitude (m) on the plane-detrended NATIVE-resolution patch, green < 0.1 m / red ≥ 0.1 m; and covered fraction per (spot, level). Panels are native data resolution (no resampling, image-rendering:pixelated). Comparison vs the fused fix (flat≤0.005, rolling≤0.005, crater_rim 0.011–0.068 m): LATTICE-FREE (single best NAC, no fusion): max 2-cell amplitude over cascade-produced levels (10m->0.625m) = 0.0147 m (rolling@10m) vs threshold 0.1 m; deepest 0.625m max = 0.0001 m. With one member the inverse-variance fuse degenerates to recon = z_bil + scaled_mu, so there is no anchor-sublattice weighting to stamp a checkerboard (the lattice motif was a multi-NAC fusion artifact).
[57.2] Apollo 17 cascade WITH sigma-floor fix — 3 spots x 6 levels (20m->0.625m) updated 9d ago (2026-06-13 22:36)
20m
10m
5m
2.5m
1.25m
0.625m
flat mare
rolling
crater rim
spot
20m
10m
5m
2.5m
1.25m
0.625m
flat_mare
0.0118
0.0049
0.0042
0.0018
0.0007
0.0003
rolling
0.0757
0.0034
0.0054
0.0017
0.0017
0.0015
crater_rim
0.1096
0.0382
0.0680
0.0408
0.0216
0.0114
FULL faithful cascade on three 320 m spots via the REAL production driver (--aoi-window crop, --sigma-floor pertile_median): per-NAC reinterp, zone routing, AM/PM fold, Mars-style overlap-crop (margin 2), and per-level realign refit (L≥2) all run as in production. The multi-NAC inverse-variance fuse now floors each (NAC,tile) σ at that tile’s median σ BEFORE weighting, so the near-zero anchor-sublattice σ no longer over-weights the bilinear anchors (~400× in the old code) and stamps the 20 m-period checkerboard. Table: 2-cell Nyquist checkerboard ELEVATION amplitude (m) on the plane-detrended NATIVE-resolution patch per (spot, level); green < 0.1 m, red ≥ 0.1 m. Panels are native data resolution (16×16 up to 512×512 px), no resampling (image-rendering:pixelated). Verdict: LATTICE GONE at all cascade-produced levels (10m->0.625m): max 2-cell amplitude = 0.0680 m (crater_rim@5m) vs threshold 0.1 m; max at the deepest 0.625m level = 0.0114 m. (The 20 m level is the truth[::4,::4] cascade INPUT, not an output; its amplitude is genuine terrain relief, not a checkerboard.) The per-tile-median sigma floor holds through the full 20 m -> 0.625 m cascade — the ~2-3 m checkerboard the unfloored fuse stamped at 5 m/2.5 m is gone, with no re-injection at any deep level.
[57.3] Cascade lattice fix — sigma-floor fusion test (20→10 m) updated 9d ago (2026-06-13 22:14)
V0: production 1/σ²
V1: floor 0.3 m
V3: plain mean
flat_mare
rolling
crater_rim
spot
V0
V1
V2
V3
flat_mare
0.022
0.002
0.003
0.000
rolling
0.159
0.020
0.003
0.015
crater_rim
2.104
0.020
0.009
0.003
2-cell Nyquist checkerboard ELEVATION amplitude (m), plane-detrended 32×32 (10 m) window. V0=production inverse-variance fuse (1/σ²); V1=floor 0.3 m; V2=per-tile-median σ floor; V3=plain equal-weight mean (control). The near-zero anchor-cell σ over-weights the bilinear anchor lattice ~400× in V0, stamping the checkerboard; flooring σ flattens the weight bias. Native-res hillshade (az 315 el 45); butted 32×32 tiles (no overlap-crop margin; production uses margin=2); standalone test, production logic untouched. Verdict: CONFIRMED: crater_rim 2-cell amplitude V0(prod)=2.104 m -> V1(floor0.3)=0.020 m V2(per-tile-med)=0.009 m vs V3(plain-mean)=0.003 m. The sigma floor flattens the anchor-weighted checkerboard toward the plain-mean level — the lattice was injected by the inverse-variance weighting, not the mu.
Single-step re-runs of the v28 cascade machinery on three 320 m spots (butted full 32×32 tiles, no overlap-crop margin; production uses margin=2). Panels: 2.5 m step, native 128×128 hillshade (az 315 el 45); μ maps are signed diverging (±p99). Metrics table: row-FFT magnitude at the 20 m-period bin / median of other bins, per variant. Variant E shifts each PM member’s footprint one OUTPUT cell east and takes dem_lo_PM[i,j]=dem_lo_ext[i,c0+16−j] (flip-then-decimate of the shifted hi window), so the un-mirrored anchor lattice lands on EVEN global cells like AM members. Verdict: REFUTED: predicted D >> C and E ~ C at the 20 m E-W bin; measured (2.5 m step, spot mean) A=1.22 C=1.22 D=1.16 E=1.79 — D is indistinguishable from C/A and E is the WORST. Secondary findings: (i) the PM z_bil offset mechanism is real but does not load the 20 m bin — rms(D-A)=0.71 m vs rms(C-A)=0.02 m vs rms(E-A)=0.26 m, i.e. the prescribed E fold only shrinks it ~3x (realign fields were xcorr-calibrated against the production fold, so un-shifting dem_lo re-misregisters the NAC); (ii) the lattice is already present in the bilinear-only control A (inherited from the on-disk 5 m input, A norm20=1.22 E-W / 2.51 N-S) and is STRONGER along N-S, which no E-W mirror fold can produce. The injection path must be sought elsewhere (N-S-capable: pushbroom direction, realign fields, tiling rows), acting at the 20->10 step and inherited upward.
[55.2] Apollo 17 cascade — BILINEAR ONLY (no model), 3 spots, native-res panels updated 11d ago (2026-06-11 21:48)
20m
10m
5m
2.5m
1.25m
0.625m
flat mare
rolling
crater rim
Control: bilinear_2x_preserve iterated from the 20 m anchor, no NAC, no model residual; native data resolution per panel (16×16 → 512×512 px). Smooth at every level — the earlier “pixelation below 5 m” was a NEAREST-resize display artifact at non-integer scale factors, not data. Confirms the with-model lattice originates in the cascade computation, not the bilinear prior or the renderer.
[55.3] Apollo 17 cascade — WITH MODEL, 3 spots, native-res panels updated 11d ago (2026-06-11 21:48)
20m
10m
5m
2.5m
flat mare
rolling
crater rim
Same 320 m ground patch per row; every panel is the level’s hillshade at NATIVE data resolution (16×16 up to 128×128 px) — no resampling anywhere; browser zoom shows crisp data pixels (image-rendering:pixelated). The 20 m-period lattice at 5 m / 2.5 m is REAL data structure (FFT peak 17–31× background, ~3 m sawtooth) and survived the mu×(posting/20 m) scaling nearly unchanged — injection path is NOT the scaled residual; under investigation via per-level difference FFTs.
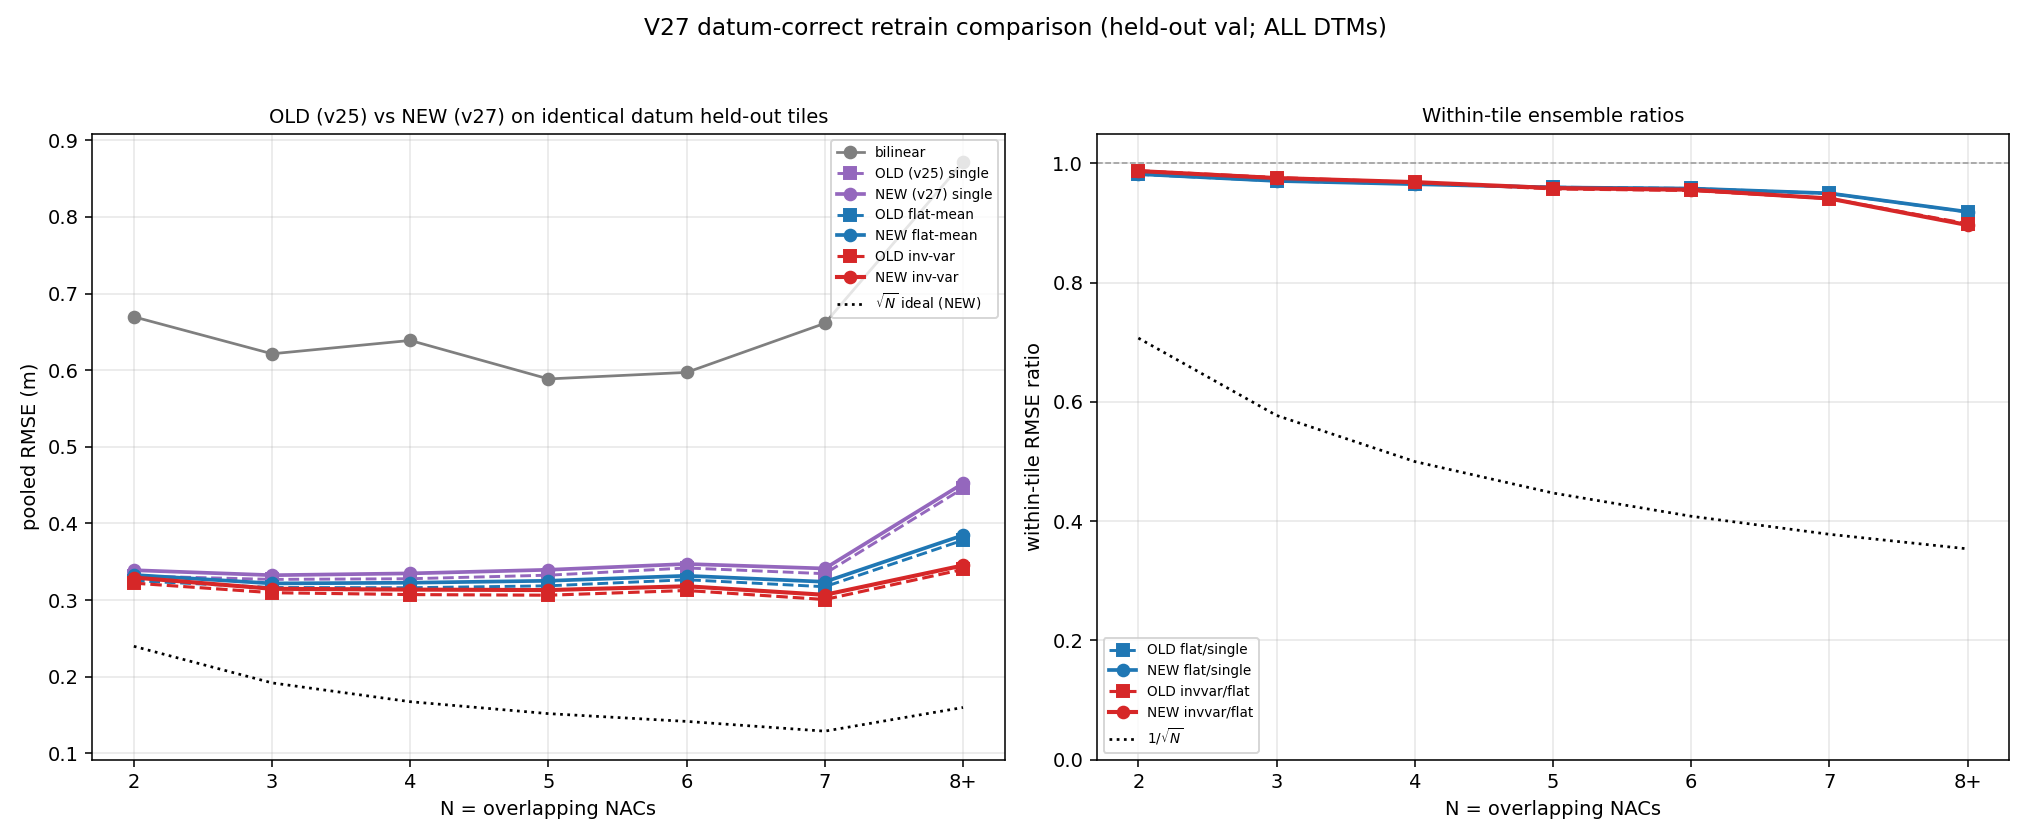
[42.1] v27 datum-correct RETRAIN — OLD (v25) vs NEW (v27) on identical held-out datum tiles updated 24d ago (2026-05-29 23:29)
Does retraining on datum-correct TRAINING data lift the numbers? The v25 models were trained on the old per-DTM-stencil tiles (truth cropped at each NAC’s aligned/shifted position — a misregistration). v27 rebuilds the TRAINING set on the fixed global datum (truth sampled once per tile, dem_lo = dem_hi[::2,::2] stride, afternoon E-W fold applied before decimation), then retrains the identical champion uncertainty config. Evaluated OLD vs NEW on the SAME corrected datum held-out set: 5116 tiles / 20 DTMs, same no-leakage split. Single-model pooled RMSE: OLD 0.423 m (+42.8% vs bilinear 0.741 m) → NEW 0.430 m (+42.0%) = +0.006 m HIGHER (worse). Ensemble at N≥8: flat-mean OLD 0.378→NEW 0.385 m, inv-var OLD 0.340→NEW 0.345 m. Per-DTM single-RMSE: NEW beats OLD on 0/20 DTMs.
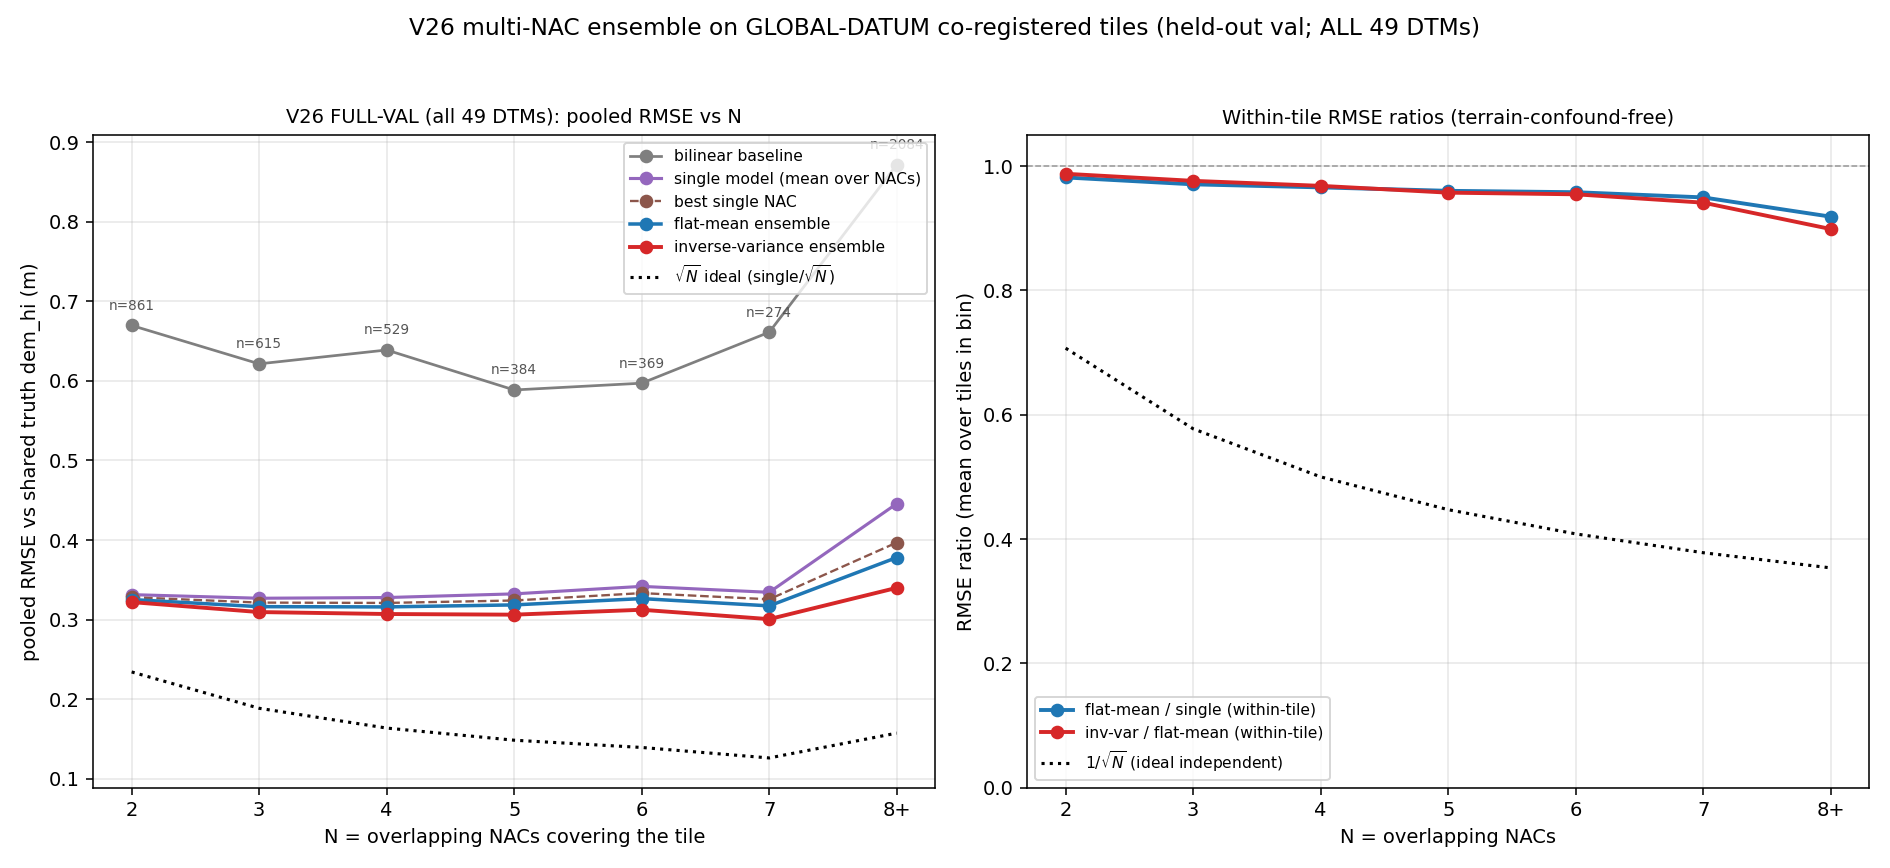
[39.1] v26 FULL-VAL generalization — corrected ensemble over ALL held-out DTMs updated 27d ago (2026-05-26 23:56)
Does the corrected subset result (5 busy DTMs, +38% single-vs-bilinear) generalize? Re-ran the corrected v26 pipeline (BUG-1 dem_lo = stride-decimation of the datum dem_hi; BUG-2 afternoon E-W fold applied before decimation) over the FULL held-out set: 5116 co-registered tiles across 20 DTMs (53228 NAC resamples), same no-leakage lat cut (val for all three per-zone models). Headline: pooled single RMSE 0.423 m vs bilinear 0.741 m = +42.8%. Per-DTM: 20/20 DTMs beat bilinear (improvement range +16% to +62%); DTMs that do NOT beat bilinear: none. At the largest N bin (8+): flat-mean 0.378 m, inv-var 0.340 m, bilinear 0.871 m; within-tile flat/single ~0.919, inv-var/flat ~0.899 (still nowhere near the 1/sqrt(N) ideal ~0.35 — reconstructions share the dem_lo input + model bias, so cross-NAC averaging cancels little). Lattice invariant max|err| 0.0e+00 m (~0 confirms the dem_lo-stride fix is active). Driver drivers/smoke/v26_fullval_ensemble.py.
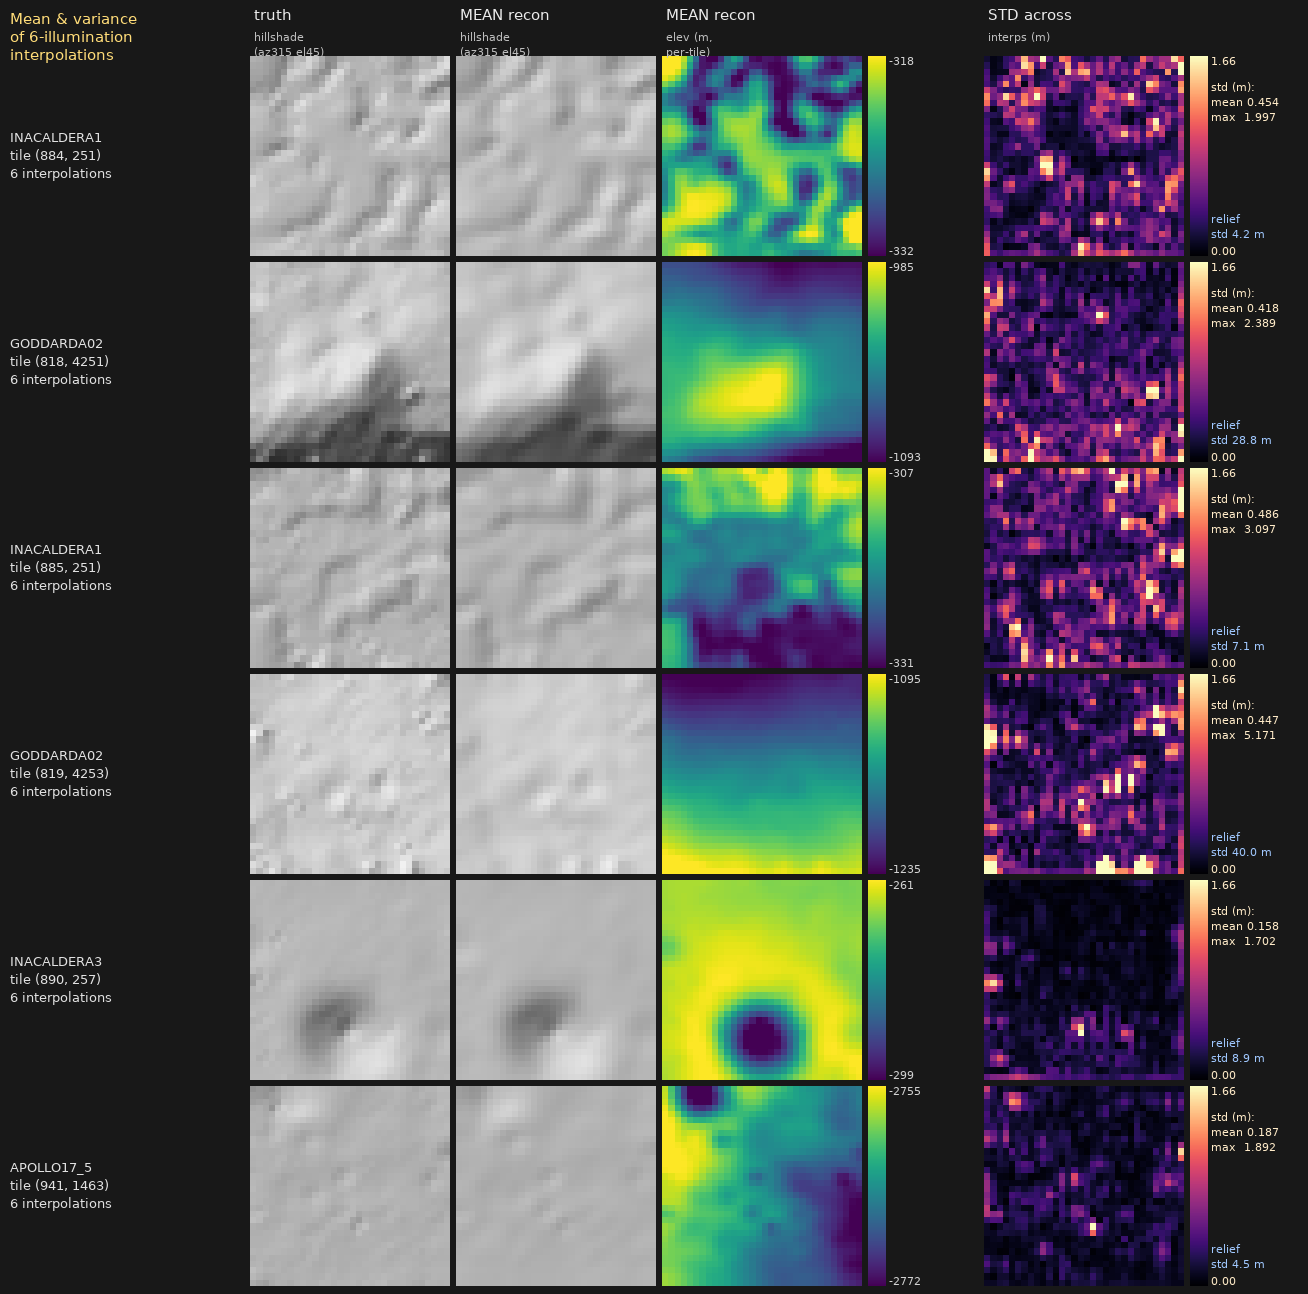
[38.1] Mean & variance of the 6-illumination interpolations (per tile) updated 28d ago (2026-05-25 20:41)
Do the DEM-enhancement reconstructions actually change with illumination? For the SAME six example tiles as the solar-lighting card (rows), each registered per-window NAC is routed to its solar-time-zone model (early/mid/late uncertainty models) and reconstructed at the native 20 m / 32×32 grid (recon = bilinear_2x(dem_lo) + μ, per-tile mean-centred, EXACTLY as v25/v26 ensemble). Col 0 = truth dem_hi hillshade (az 315°, el 45°); col 1 = MEAN reconstruction hillshade (same params, so it is directly comparable to truth); col 2 = MEAN reconstruction elevation (per-tile viridis + colorbar); col 3 = per-pixel standard deviation across the 6 interpolations in meters (magma + colorbar; each panel annotated with its mean & max std and the tile’s truth relief std for scale). Aggregate over 6 tiles: mean per-pixel std 0.358 m, max per-pixel std 2.708 m, vs truth relief std 15.6 m — the spread is ~44× smaller than the terrain relief. Interpretation: the reconstructions barely differ across illumination, so variable lighting adds little information beyond the DEM — consistent with the finding that multi-NAC ensembling gives ~no variance reduction. Driver drivers/smoke/v26_mean_variance_grid.py (reuses the v26 solar-lighting tile selection + the v26 datum recon code).
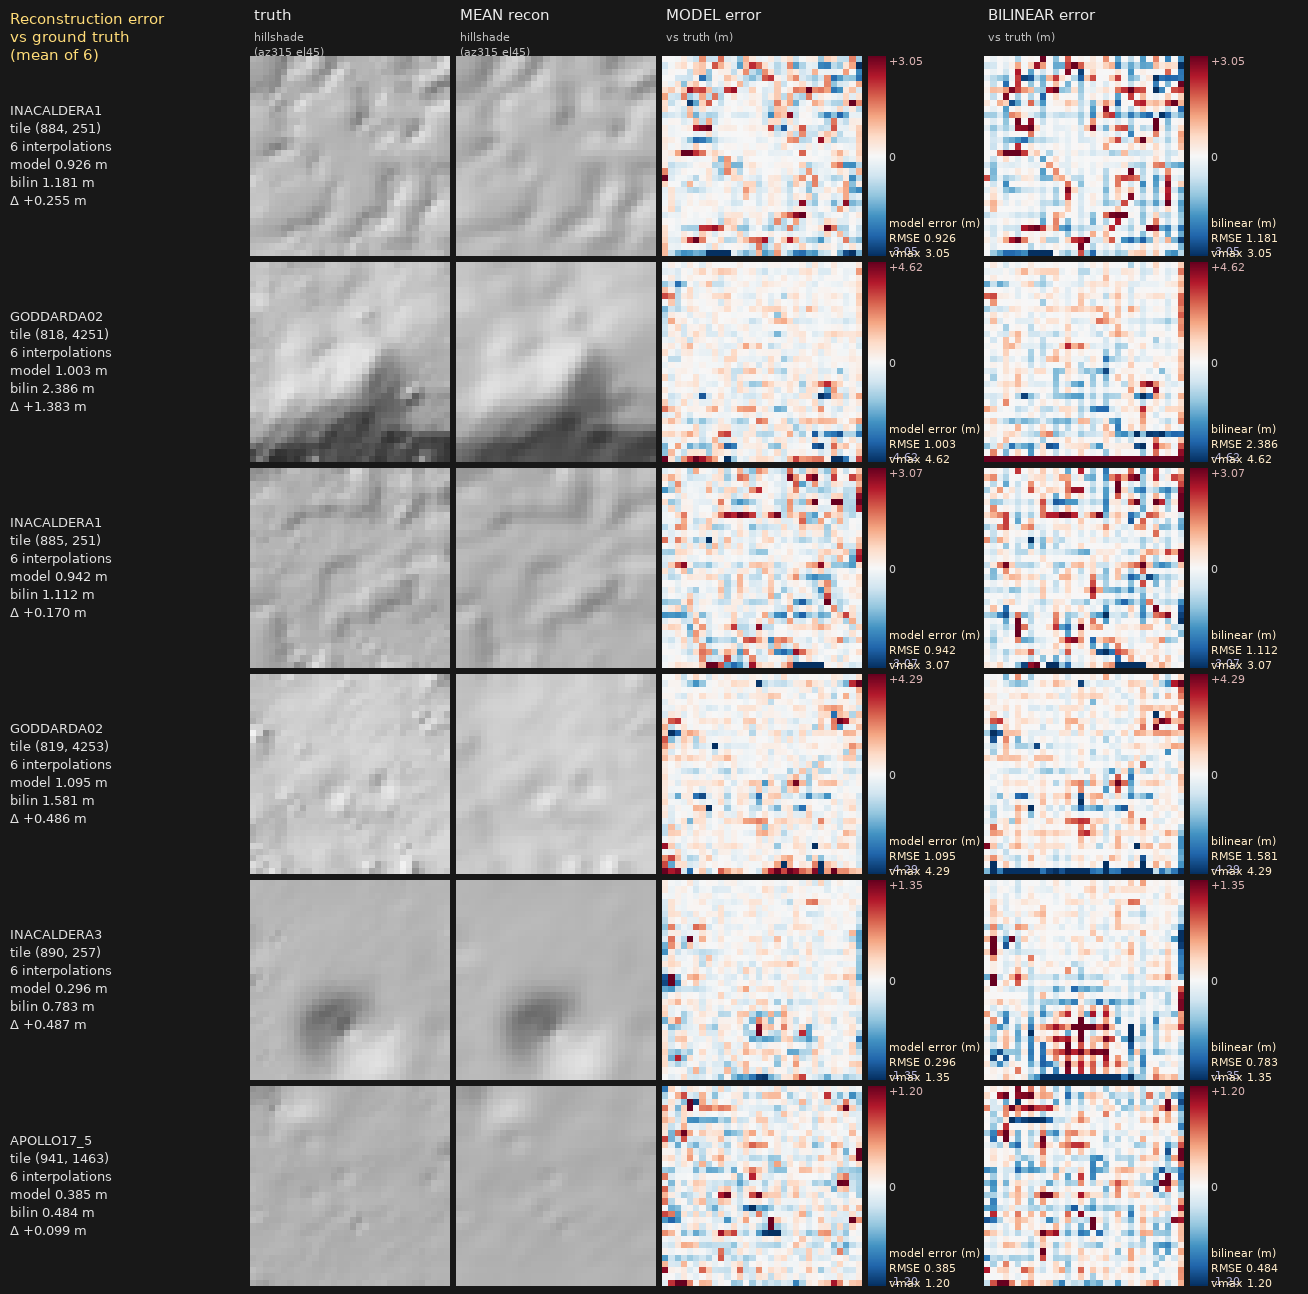
[38.2] Reconstruction error vs ground truth (mean of 6 interpolations) — model vs bilinear updated 28d ago (2026-05-25 20:40)
Does the NAC-driven model actually reduce error over just upsampling the coarse DEM? For the SAME six example tiles as the mean/variance card (rows), each per-window NAC is routed to its solar-time-zone uncertainty model (early/mid/late) and reconstructed at the native 20 m / 32×32 grid (recon = bilinear_2x(dem_lo) + μ, per-tile mean-centred, EXACTLY as v25/v26); the per-tile mean of the 6 reconstructions is compared to truth dem_hi. Col 0 = truth hillshade (az 315°, el 45°); col 1 = mean-recon hillshade; col 2 = model error (mean-recon − truth, signed meters, RdBu_r centred at 0, per-row symmetric vmax = p98 |error|); col 3 = bilinear-baseline error (bilinear_2x(dem_lo) − truth) on the SAME colormap + SAME vmax, so col 2 vs col 3 is directly comparable. Each error panel is annotated with its RMSE (m). Aggregate over 6 tiles: model RMSE 0.774 m vs bilinear RMSE 1.254 m — the model reduces RMSE by +0.480 m (+38.3%). With the corrected datum recon (dem_lo = dem_hi[::2,::2] stride decimation; the afternoon E-W fold applied consistently to NAC + DEM before decimation), the bilinear baseline is now sample-preserving (col 3 shows the 1-in-4 zero lattice) and the model genuinely beats it — residual error concentrates on crater rims and steep slopes (high-frequency topography the coarse prior cannot represent). Driver drivers/smoke/v26_error_vs_truth_grid.py (reuses the v26 mean/variance recon machinery + tile selection).
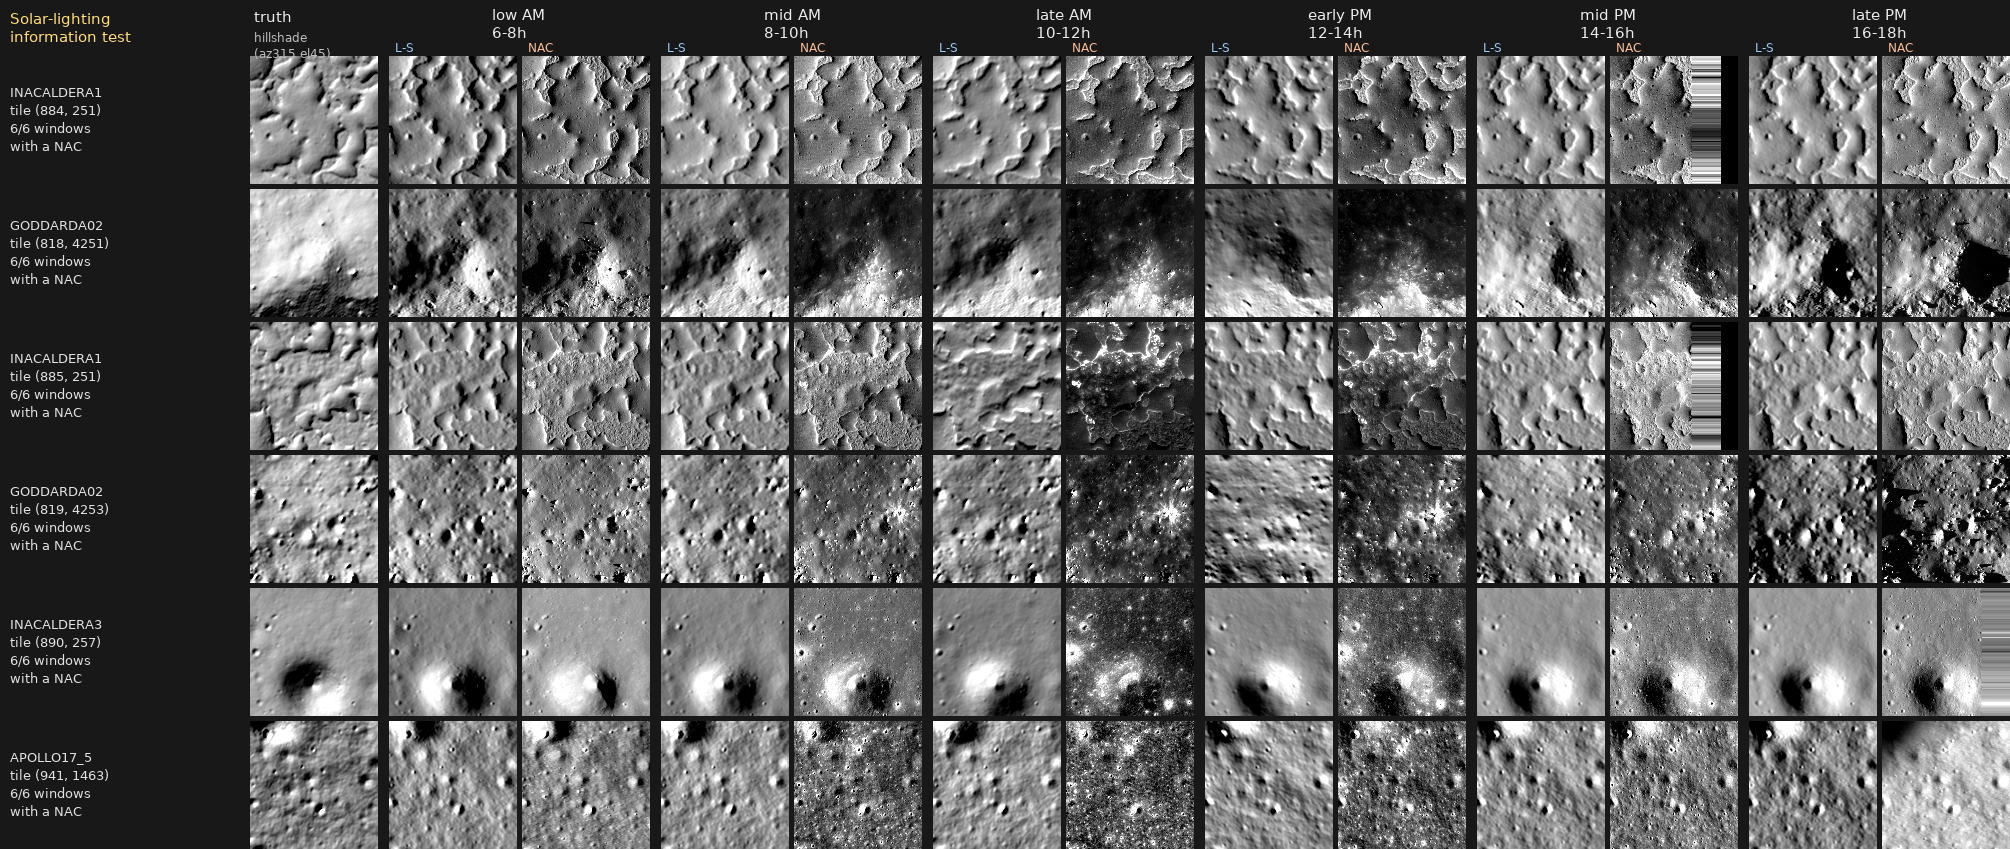
[37.1] Solar-lighting information test — truth hillshade + 6 windows (L-S vs registered NAC) updated 29d ago (2026-05-24 21:02)
Does variable solar illumination add topographic information beyond the DEM? Six example tiles (rows) with broad solar-time coverage, each rendered at the truth DTM’s native ~5 m posting (128×128 px per 640 m tile). Col 0 = standard hillshade (sun az 315°, el 45°) of the highest-available DEM (the native truth DTM) — the topography reference. Cols 1–12 = six (Lommel-Seeliger render, registered NAC) pairs, one per solar-time window (low/mid/late morning, early/mid/late afternoon). The L-S is lit with the TRUE sun az/el for that window — morning sun from the EAST, afternoon from the WEST, no E–W mirror fold (unfolded true-illumination view); when a NAC populates the window the L-S uses THAT NAC’s true az/el (v24_sun_geom.json) so the pair matches exactly, otherwise the window-centre local-solar-time geometry at the tile lat/lon. The NAC is the registered reflectance resampled onto the same tile grid (true ground orientation, realign applied); a black “No NAC” square marks empty windows. NACs are binned by true local solar time, so afternoon NACs land in the PM windows. If lighting adds information, the same crater should reveal different structure as the sun sweeps across the day — and the L-S/NAC pair within each window should coincide. Driver drivers/smoke/v26_solar_lighting_grid.py (reuses v26_datum_tiles grid + truth/NAC sampling and the ny-sign-corrected L-S helper).
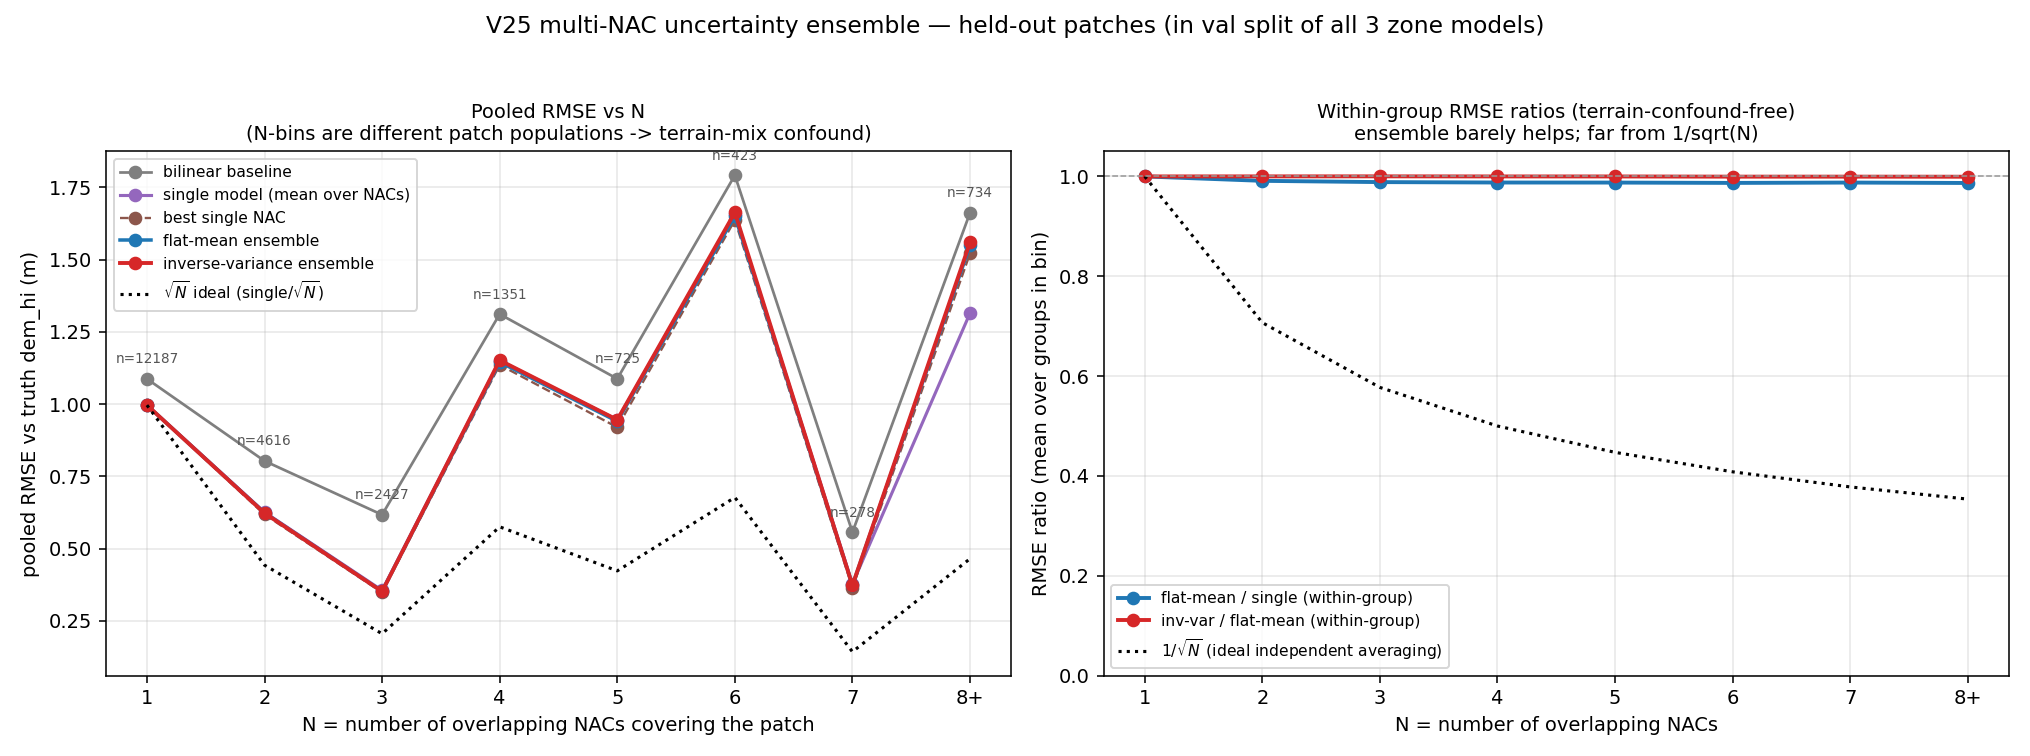
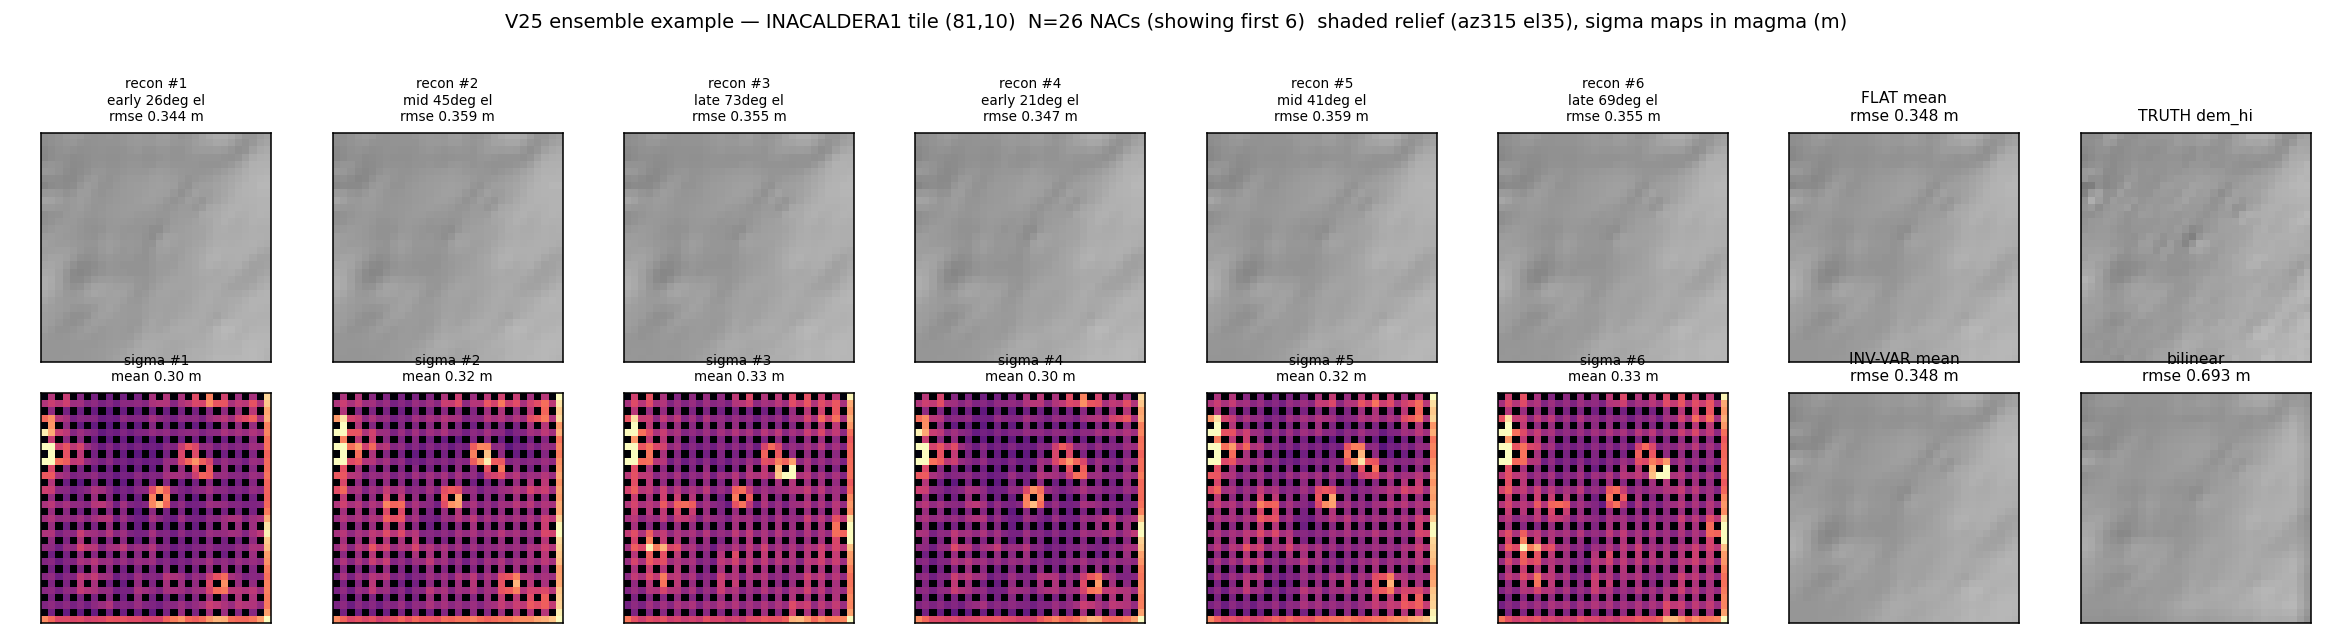
[37.2] v25 multi-NAC uncertainty ensemble — RMSE vs N (capstone) updated 29d ago (2026-05-24 09:58)
Three solar-time-specialized uncertainty models (early/mid/late) each emit a per-pixel residual-on-bilinear (mu) and log-variance (sigma=exp(s/2)). For every ground patch (dtm,tile_r,tile_c) covered by N overlapping NACs we combine the N quasi-independent reconstructions by flat mean and by inverse-variance weighting, on a held-out set (22741 patches in the VAL split of all three models). Finding: averaging barely helps. The terrain-confound-free within-group ratio (right panel) shows flat-mean/single plateaus at ~0.987 (a ~1.3% RMSE cut), nowhere near the 1/sqrt(N) ideal (~0.35 at N=8), and inverse-variance/flat-mean ~0.999 (essentially tied — inv-var does not beat flat). The reconstructions are NOT independent: they share the same coarse dem_lo input and the same systematic model bias, so cross-NAC averaging cancels little error. The sigma maps (example, magma) are dominated by the bilinear-lattice checkerboard (high confidence on the even-even dem_lo lattice, lower at interpolated cells) — the same for every member, leaving inv-var nothing to re-weight. Single-model RMSE ~1.00 m vs bilinear ~1.09 m (N=1 bin). Left-panel absolute RMSE-vs-N is non-monotonic because each N-bin is a different patch population (terrain-mix confound); the within-group ratio is the clean signal. Driver drivers/smoke/v25_ensemble_test.py.
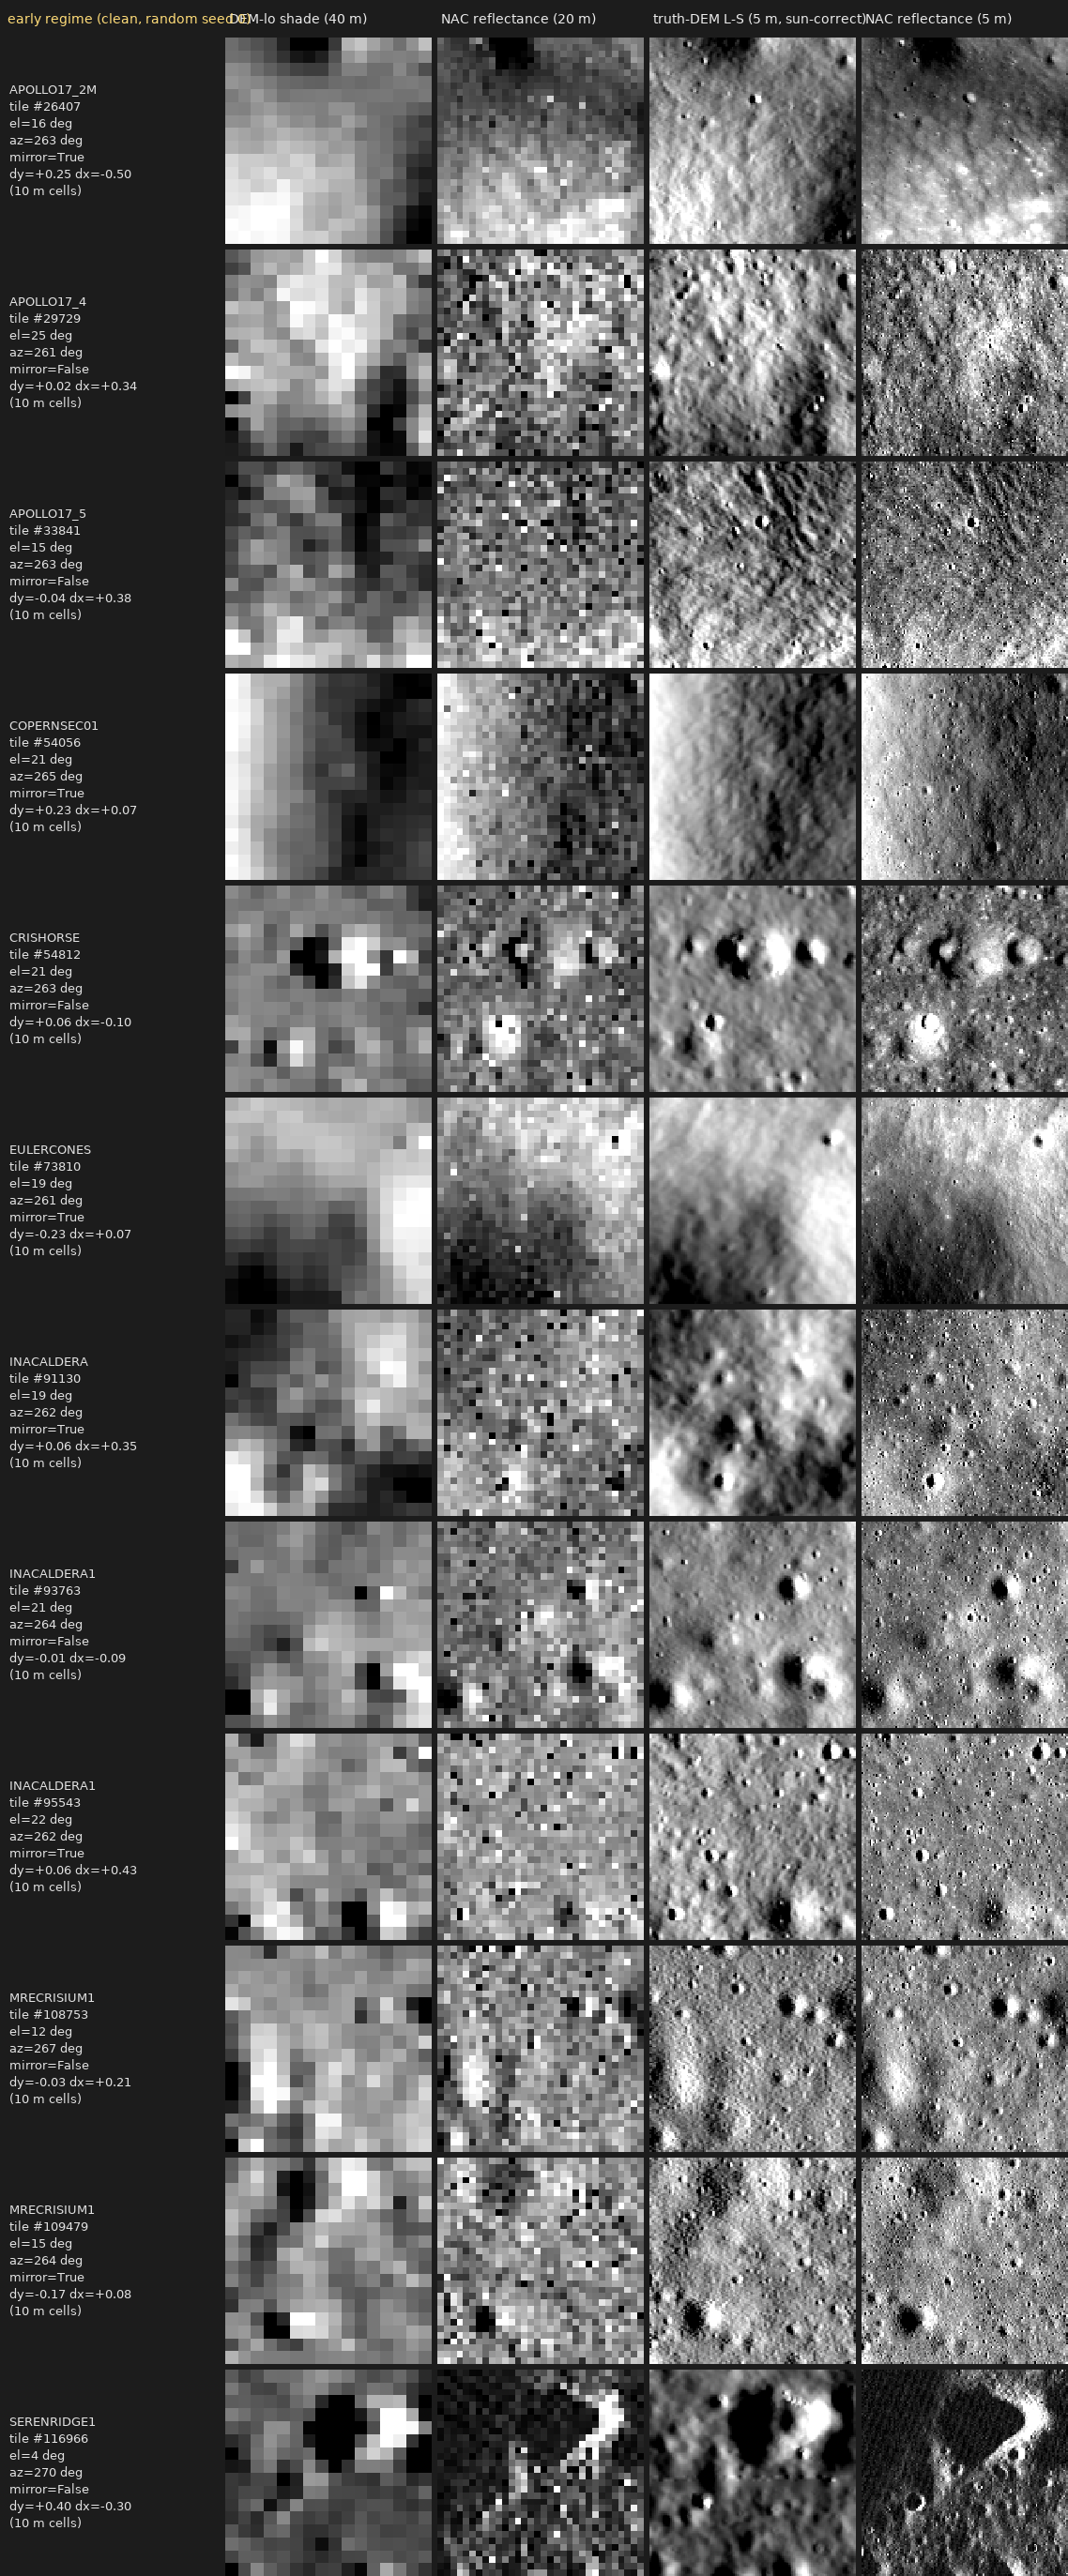
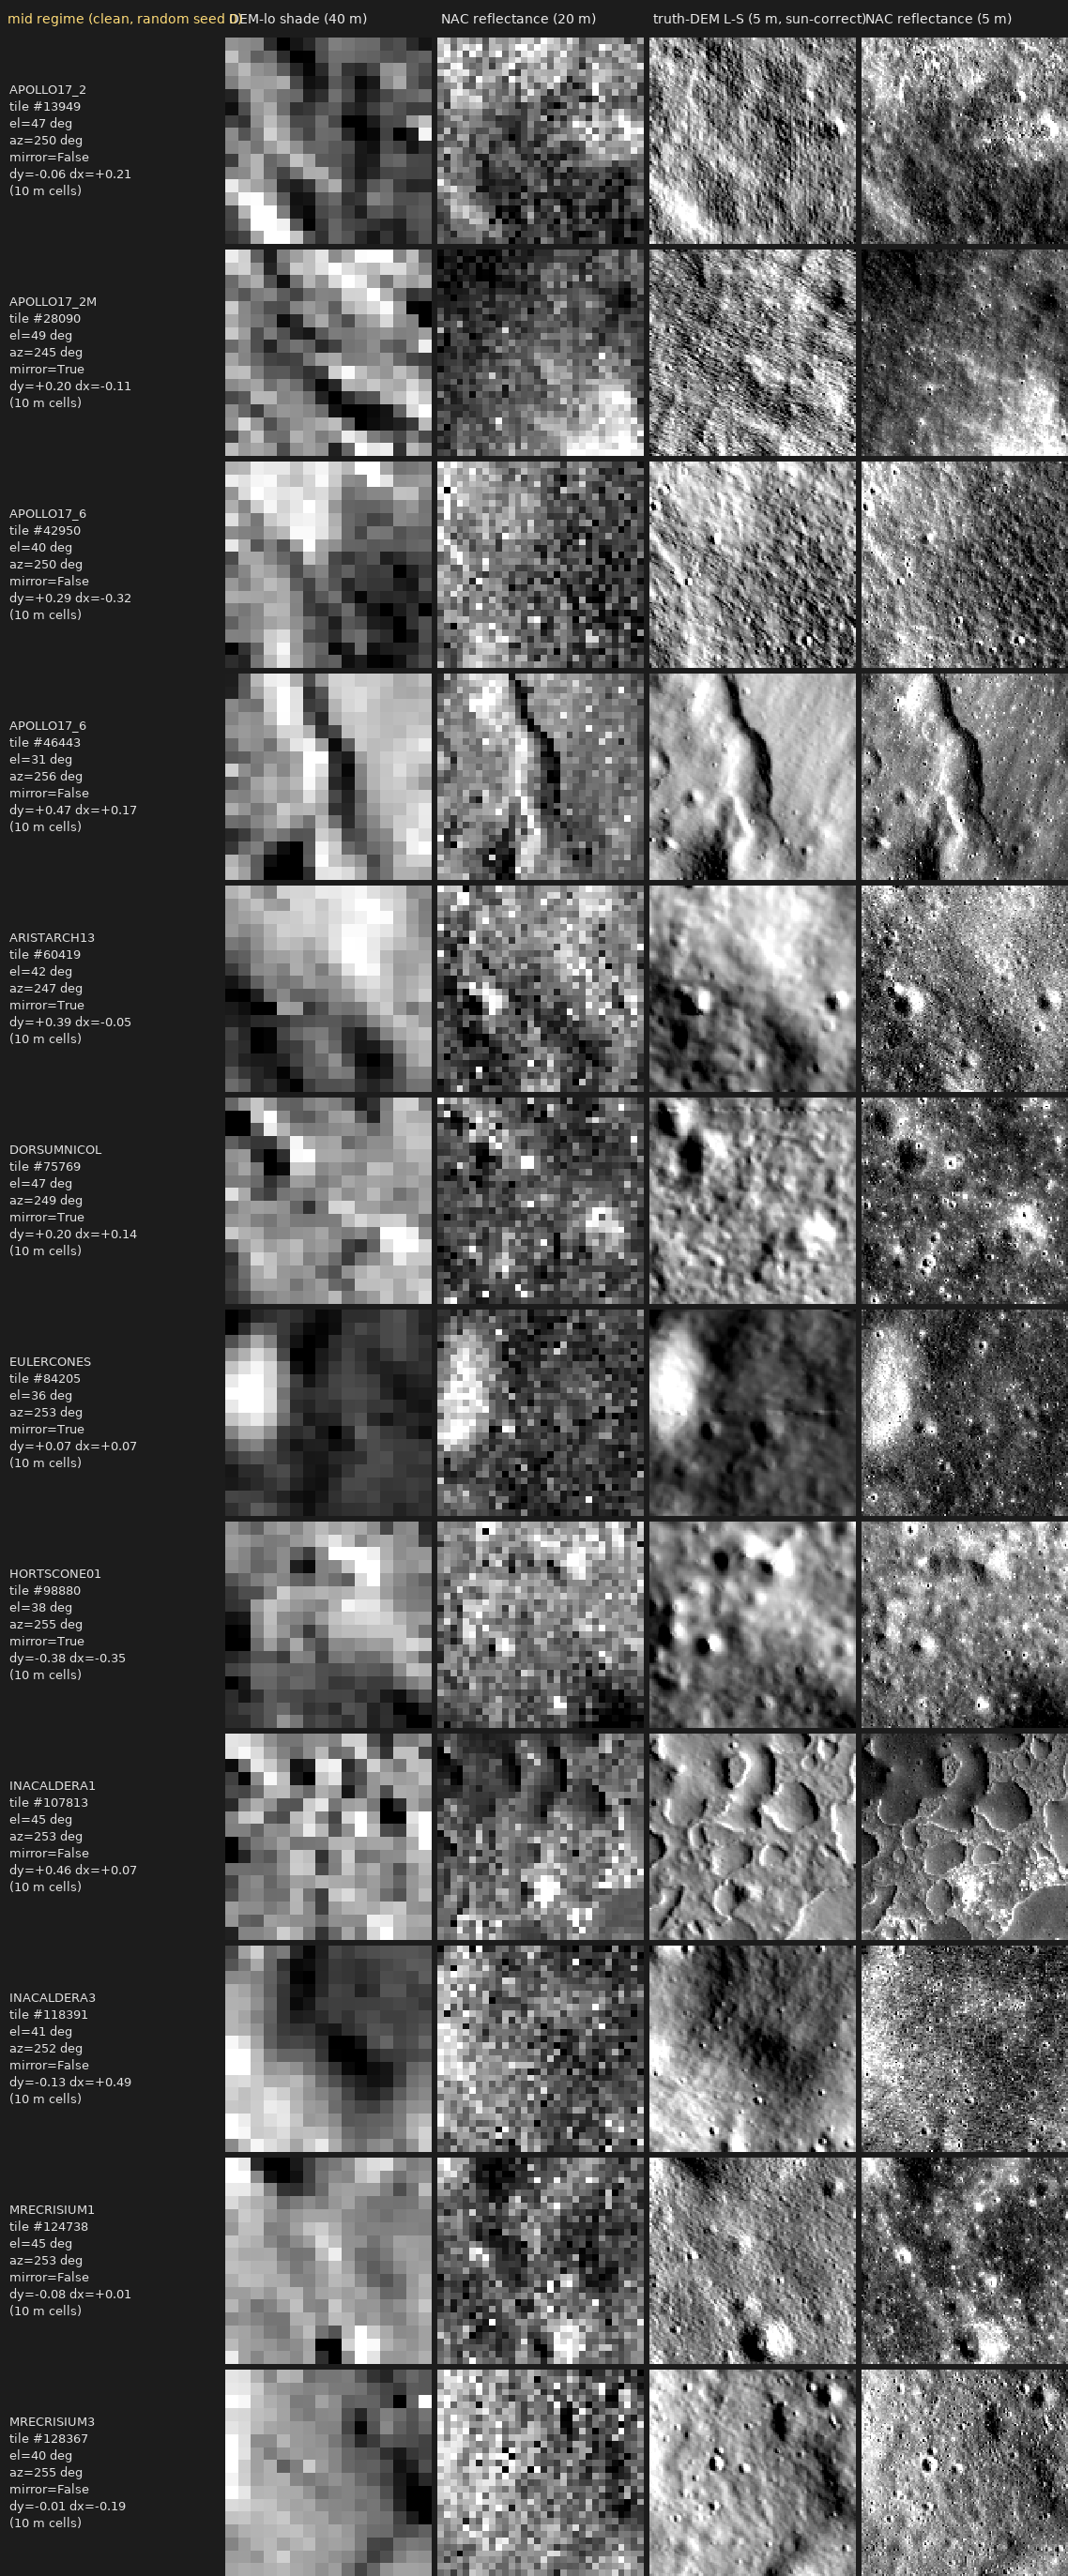
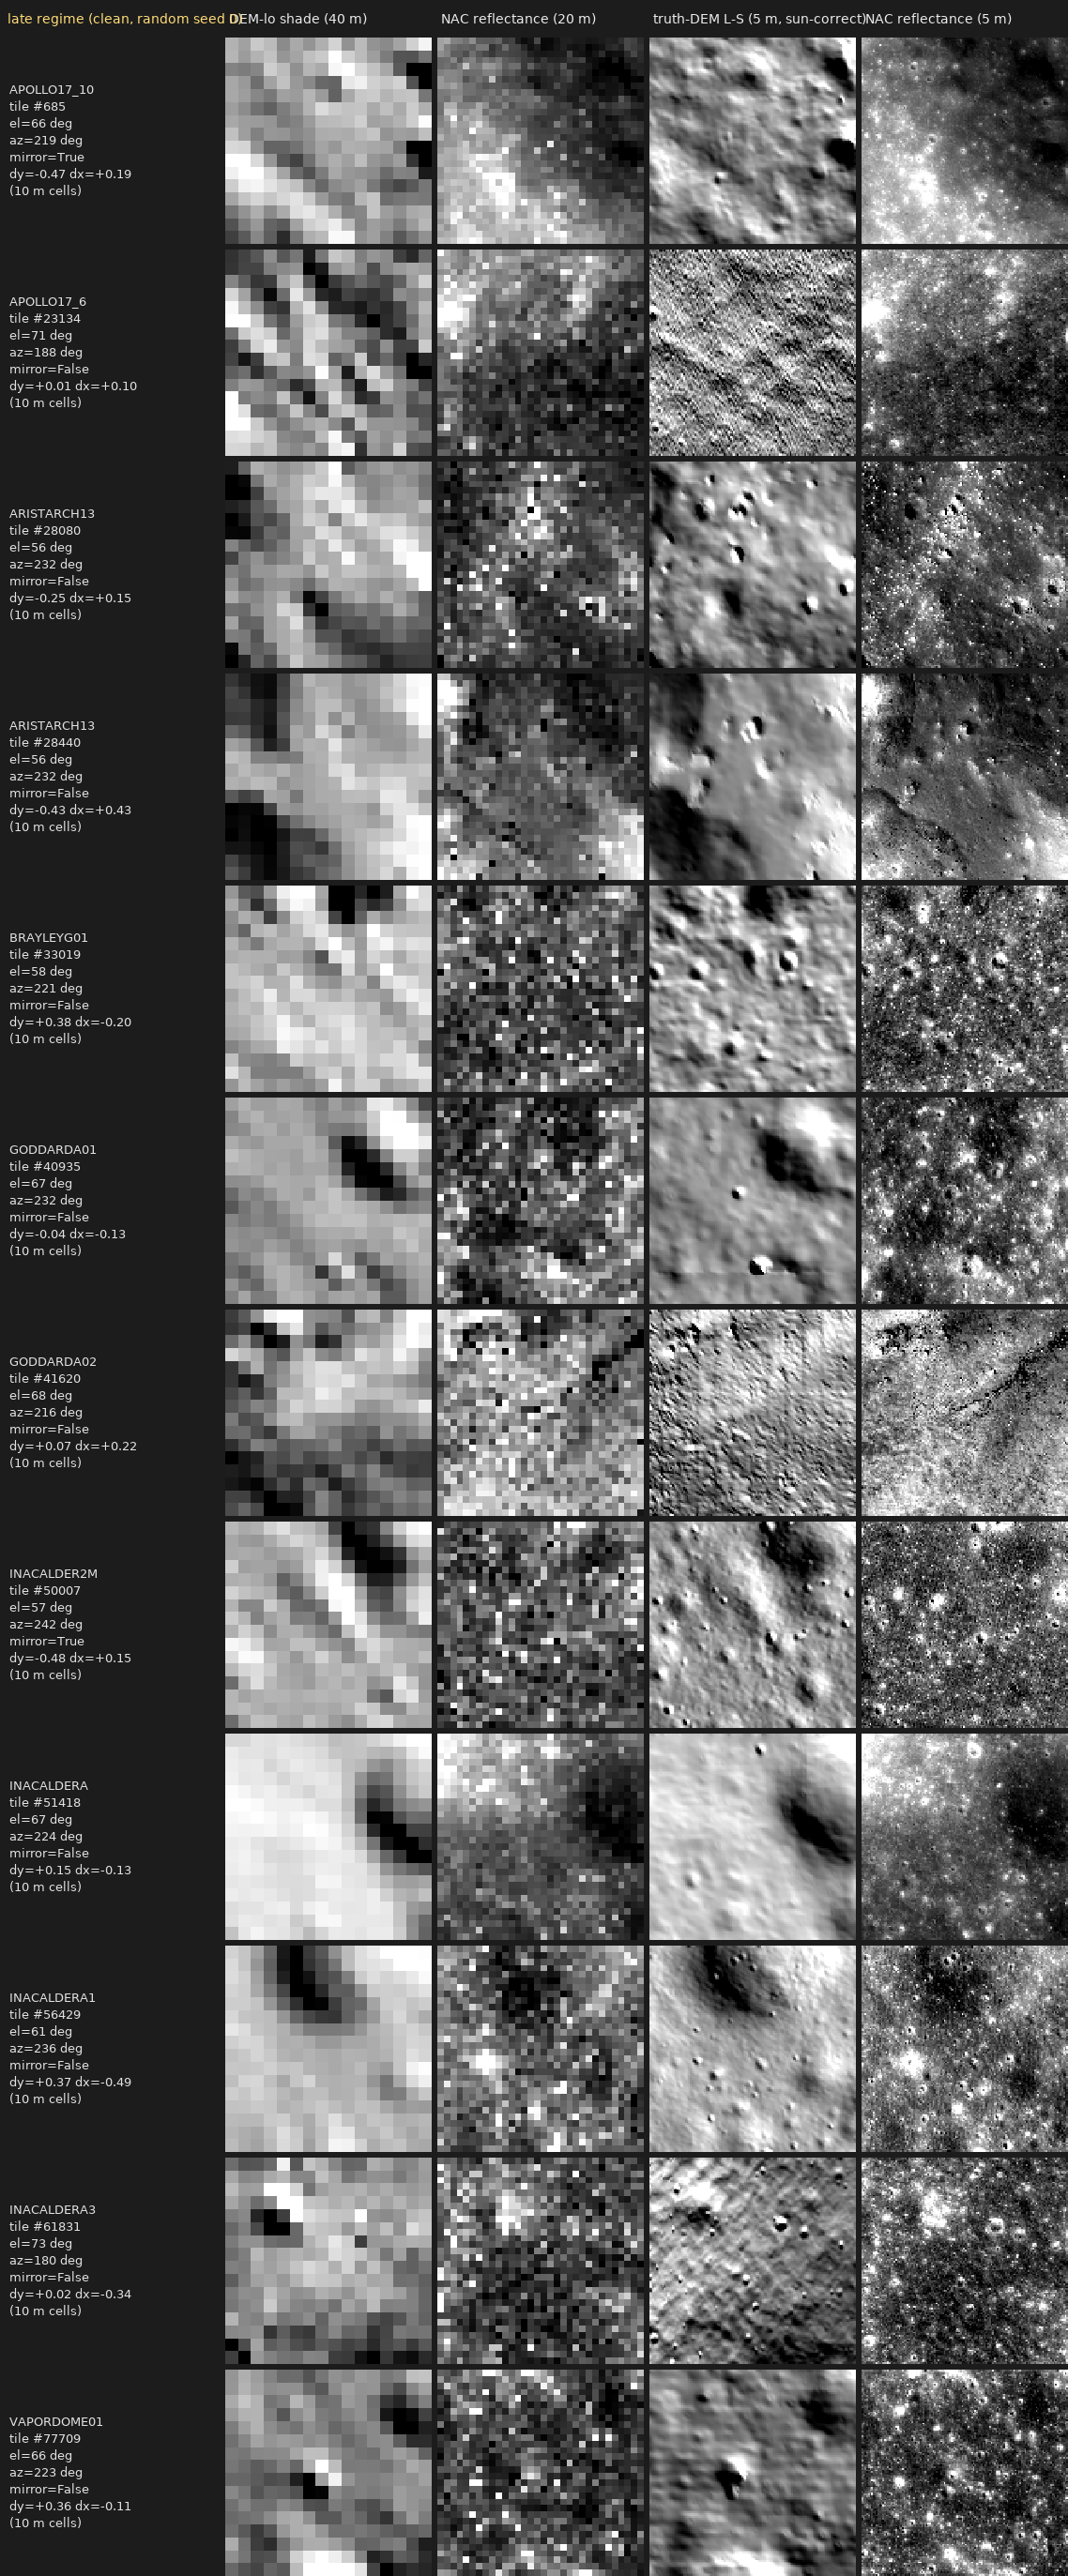
[36.1] NAC↔DEM alignment sanity — early / mid / late solar time updated 30d ago (2026-05-23 22:06)
A dozen training-tile inspection strips per solar-time regime (4 panels each: DEM-lo shade (40 m, reference) · NAC reflectance (20 m) · truth-DEM L-S shade (5 m, sun-correct, E-W mirrored for afternoon tiles) · NAC reflectance (5 m); per-row label carries the DTM, tile index, sun el/az, mirror flag and the xcorr dy/dx shift). Tiles are now RANDOM-sampled (seed 0) from the CLEANED merged zone datasets (v23early/_/late_dataset_clean.npz) — banded incomplete-NAC tiles and NaN tiles have been scrubbed (clean counts: early 120,345 · mid 136,434 · late 78,058). The money comparison is col 2 vs col 3: both at the highest available resolution (~5 m) with consistent sun, so craters/ridges should coincide if the NAC and DEM are co-registered. Scarcity caveat: the late (high-sun) zone has the FEWEST tiles and its champion barely beats baseline (val RMSE 1.02 m, best at step 500) because near-noon NACs carry little shadow/topography signal for the model to exploit. Driver montage_v24_align.py reusing the high-res reprojection from v23_tier_examples.py.
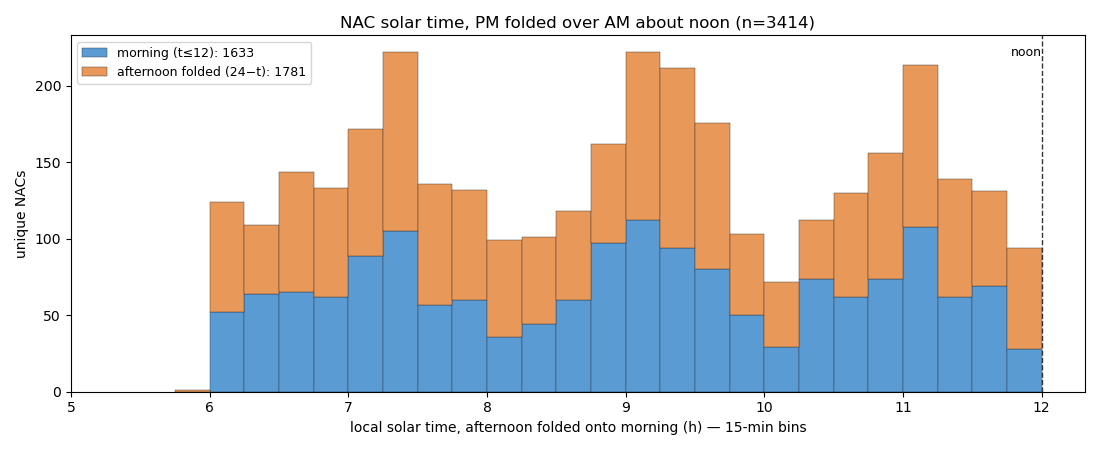
[33.1] NAC solar time — afternoon folded onto morning updated 33d ago (2026-05-20 21:36)
Same NACs, but afternoon times reflected about local noon (t→24−t) and stacked on the morning — the illumination-time coverage the pipeline actually sees after its E-W mirror fold. Morning 1633 vs afternoon 1781 NACs — well balanced, so folding ~doubles coverage at each distance-from-noon with no major AM/PM skew. x = morning solar time (12 = noon, 6 = ±6 h from noon), 15-min bins. Driver drivers/smoke/v24_sun_geom_plots.py.
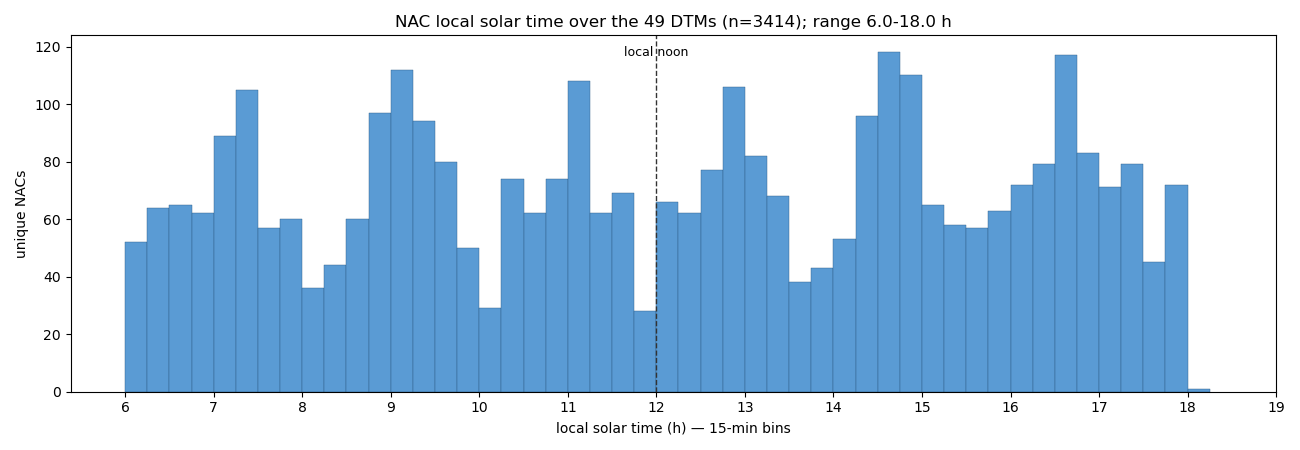
[33.2] NAC local solar time (15-min bins) updated 33d ago (2026-05-20 21:36)
Local solar time per NAC (hour angle = target_lon − subsolar_lon), 15-min bins. Spans the full 6–18 h day, roughly symmetric about noon, with the LROC orbital-sampling ripple. (The earlier 30–50° training set had a 10–14 h gap because near-noon sun exceeds 50°; including the high bands fills it.) Driver drivers/smoke/v24_sun_geom_plots.py.
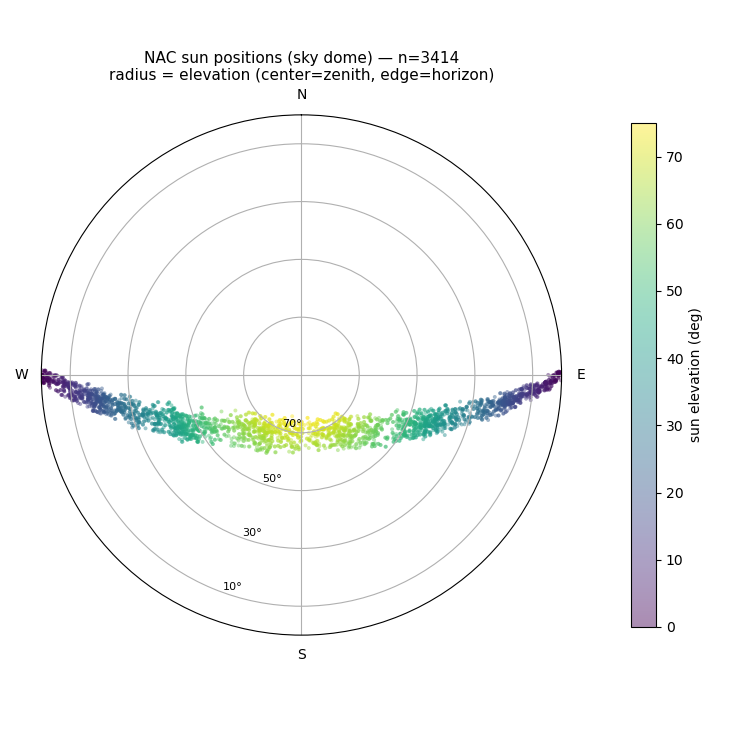
[33.3] NAC sun positions — az/el sky dome updated 33d ago (2026-05-20 21:36)
All 3,414 NACs as sun positions on the sky dome: azimuth = compass bearing (N top, clockwise), radius = elevation (center = zenith, edge = horizon), colour = elevation. The E→S→W arc sits entirely in the southern sky and tops out at ~75° (never overhead at these latitudes). Near the top the high-sun points spread horizontally — the azimuth sweeps fast while elevation plateaus. Driver drivers/smoke/v24_sun_geom_plots.py.
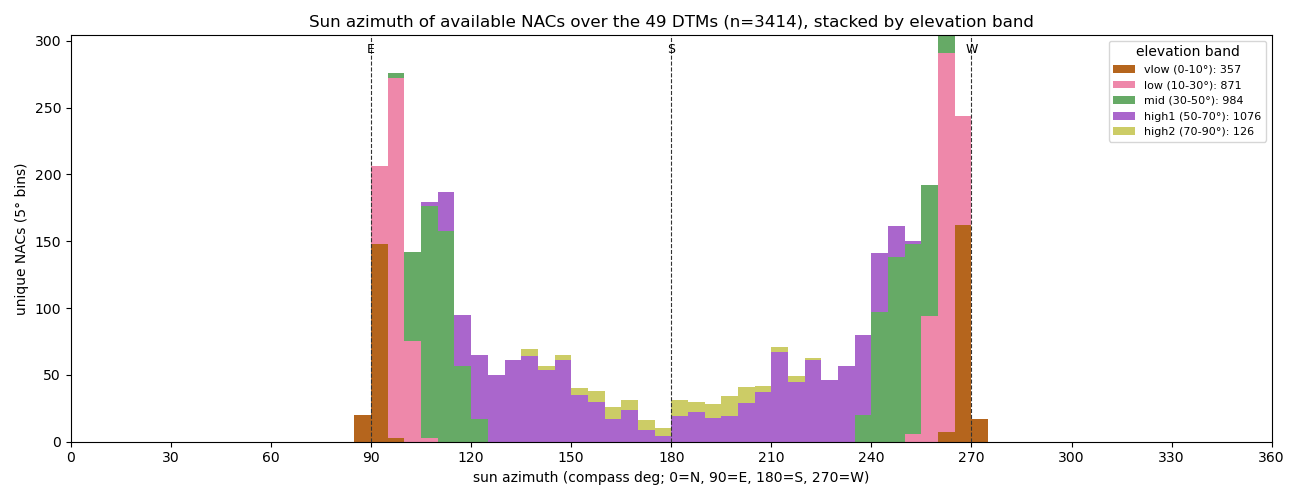
[33.4] Sun-azimuth availability of NACs (49 DTMs), by elevation band updated 33d ago (2026-05-20 21:19)
True solar azimuth per NAC, computed via SPICE from each NAC's UTC + center lat/lon (ODE sub_solar_az is NaN), stacked by elevation band. Azimuth spans only 89–271° — the sun stays in the southern sky (E→S→W transit) for these northern targets. Low-sun bands (vlow/low) spike hard at E (~90°) and W (~270°) — sunrise/sunset — while high1 (50–70°) spreads broadly across ~120–250° and never reaches the E/W extremes. Note the dip right at due-south (180°): near the meridian the high sun sweeps azimuth fastest, so fewer NACs catch it exactly at S — i.e. "stationary elevation, fast-moving azimuth," as expected. So a single high band still mixes a wide azimuth range; az conditioning (or sub-binning) may matter more there than at low sun. Cached: v24_sun_az_el.json; driver drivers/smoke/v24_sun_az_histogram.py.
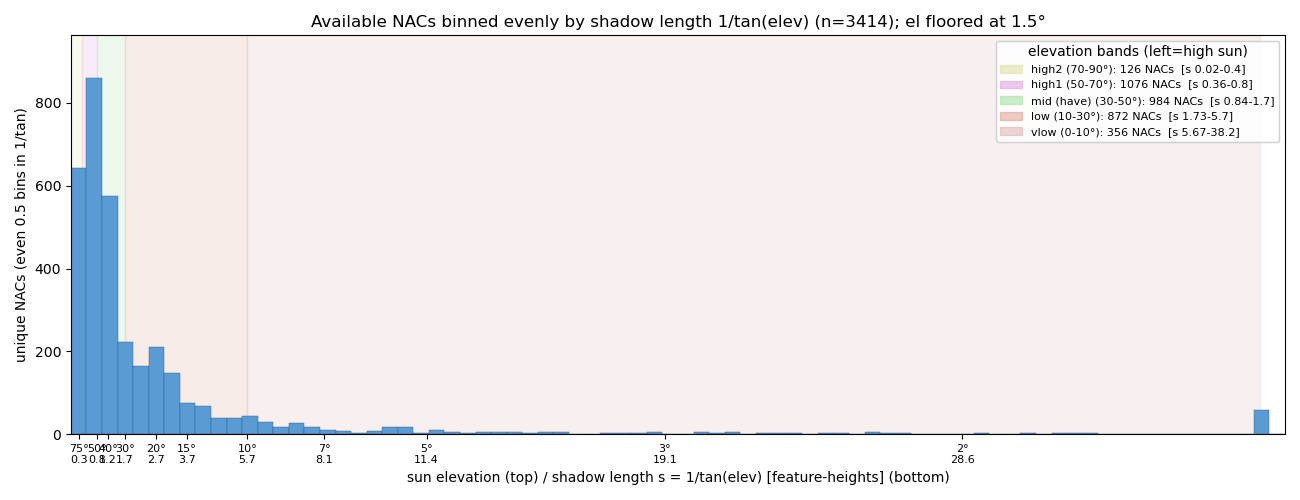
[33.5] NAC availability binned by shadow length 1/tan(elev) updated 33d ago (2026-05-20 21:10)
Same 3,414 NACs as the elevation histogram, but binned evenly by shadow length per unit height, s = 1/tan(θ) (cast-shadow length of a 1 m feature) — the physical difficulty axis. Equal bins = equal shadow-length increments. The data piles up at short shadows (s<1.7, sun >30°) and thins to almost nothing across the long-shadow tail: low (10–30°) spans s 1.7–5.7, vlow (0–10°) spans s 5.7–38 with very few samples. So in difficulty-equalized terms the low-sun regimes are badly under-sampled. Far-right bar = el≤1.5° pile-up (floor to avoid cot→∞). x-axis shows elevation (top) and s (bottom). Driver drivers/smoke/v24_shadowlen_histogram.py.
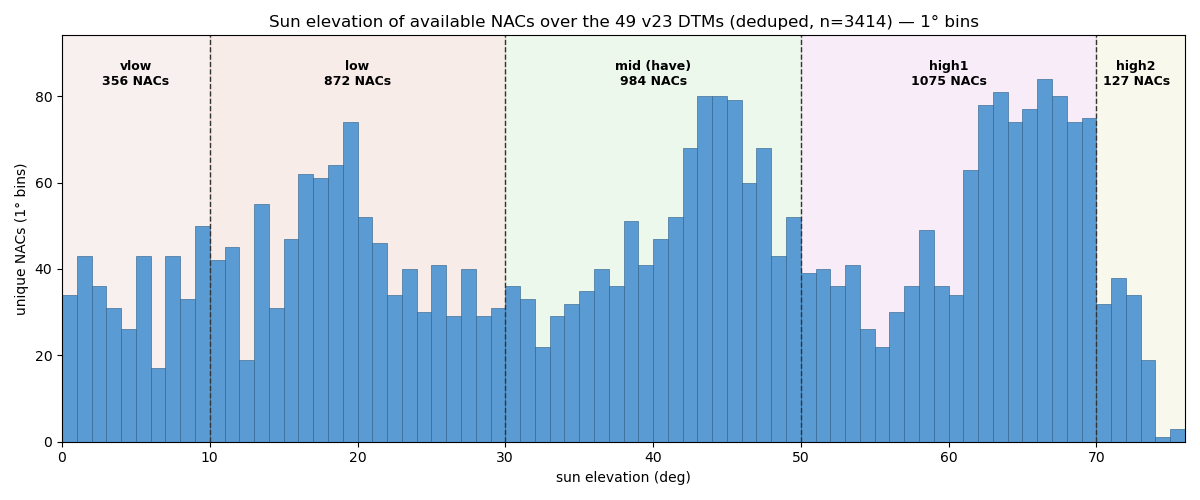
[33.6] Sun-elevation availability of NACs (49 DTMs) — 1° bins updated 33d ago (2026-05-20 21:04)
All 3,414 unique NACs that overlap the 49 northern DTMs (deduped by product_id across the band inventories), binned by sun elevation 0–75°. Candidate bands: vlow 0–10° (356), low 10–30° (872), mid 30–50° (984, the existing trained set), high1 50–70° (1075), high2 70–90° (127). The distribution dies at ~75° — at these latitudes (~15–25°N) the noon sun never gets higher. The 0–10° tail is real but shadow-dominated (shadow length = h/tan θ → ~6× feature height at 10°, ~29× at 2°), so low usable-tile yield. All overlapping NACs are downloading now; binning into final training sets is TBD. Elevation from ODE incidence (90−incidence; ODE solar_elev is NaN). Driver drivers/smoke/v24_sun_el_histogram.py.
[33.7] v24 constellation — 2-channel + slope loss (w=0.5) — 15/15 runs updated 33d ago (2026-05-20 13:11)
run
params
wd
val full
val rough
val smooth
train full
gap
rough vs bil
XS_wd3e-3
0.35M
0.003
0.7365
1.1467
0.3741
0.4689
0.268
+31.2%
M_wd1e-2
1.27M
0.01
0.7343
1.1474
0.3631
0.3856
0.349
+31.1%
M_wd3e-3
1.27M
0.003
0.7402
1.1509
0.3779
0.4415
0.299
+30.9%
XS_wd1e-3
0.35M
0.001
0.7476
1.1593
0.3874
0.4915
0.256
+30.4%
XL_wd1e-3
6.18M
0.001
0.7499
1.1678
0.3766
0.3597
0.390
+29.9%
XL_wd3e-3
6.18M
0.003
0.7550
1.1774
0.3767
0.3468
0.408
+29.3%
XS_wd1e-2
0.35M
0.01
0.7661
1.1943
0.3875
0.4893
0.277
+28.3%
XL_wd1e-2
6.18M
0.01
0.7787
1.2118
0.3880
0.2302
0.549
+27.3%
M_wd1e-3
1.27M
0.001
0.7789
1.2300
0.3659
0.4193
0.360
+26.2%
L_wd1e-3
3.17M
0.001
0.7856
1.2396
0.3692
0.3805
0.405
+25.6%
L_wd3e-3
3.17M
0.003
0.7899
1.2400
0.3854
0.5079
0.282
+25.6%
L_wd1e-2
3.17M
0.01
0.7868
1.2425
0.3673
0.3555
0.431
+25.4%
S_wd1e-3
0.80M
0.001
0.7919
1.2508
0.3736
0.4466
0.345
+24.9%
S_wd3e-3
0.80M
0.003
0.7982
1.2597
0.3788
0.4574
0.341
+24.4%
S_wd1e-2
0.80M
0.01
0.8102
1.2667
0.4043
0.5323
0.278
+24.0%
2-channel (NAC + dem_lo) input PLUS a finite-difference slope term added to the training loss (Charbonnier on dz/dx, dz/dy; weight 0.5). Note: the leaderboard metric is still plain elevation RMSE — it does not directly reward the slope term, so compare to the 2-channel table above (best there: XS_wd1e-2, full 0.694 / rough 1.064). A higher elevation RMSE here with better relief would not show in these columns. Driver drivers/smoke/v24_constellation.py --variant demlo_slope.
Same grid + eval as the 1-channel leaderboard above, but the model now ALSO sees the coarse DEM (bilinear-upsampled dem_lo) as a 2nd input channel — still predicting a residual on bilinear. Compare directly to the 1-channel table: 1-ch best was XL_wd3e-3 at val_full 0.974 / rough 1.548. Driver drivers/smoke/v24_constellation.py --variant demlo.
[33.9] v24 constellation leaderboard — 15/15 runs (sorted by rough-terrain val RMSE) updated 34d ago (2026-05-20 01:45)
run
params
wd
val full
val rough
val smooth
train full
gap
rough vs bil
XL_wd3e-3
6.18M
0.003
0.9737
1.5477
0.4123
0.6435
0.330
+7.1%
XL_wd1e-2
6.18M
0.01
0.9782
1.5542
0.4130
0.6016
0.377
+6.7%
XL_wd1e-3
6.18M
0.001
0.9797
1.5591
0.4085
0.5887
0.391
+6.4%
L_wd1e-3
3.17M
0.001
0.9866
1.5640
0.4230
0.6745
0.312
+6.1%
L_wd1e-2
3.17M
0.01
0.9875
1.5656
0.4181
0.4826
0.505
+6.0%
L_wd3e-3
3.17M
0.003
0.9874
1.5672
0.4147
0.4717
0.516
+5.9%
M_wd1e-3
1.27M
0.001
0.9961
1.5765
0.4289
0.5680
0.428
+5.4%
M_wd1e-2
1.27M
0.01
0.9979
1.5773
0.4334
0.7047
0.293
+5.3%
S_wd1e-3
0.79M
0.001
0.9988
1.5854
0.4247
0.6792
0.320
+4.9%
S_wd3e-3
0.79M
0.003
1.0008
1.5873
0.4277
0.6811
0.320
+4.7%
M_wd3e-3
1.27M
0.003
1.0025
1.5877
0.4327
0.7495
0.253
+4.7%
S_wd1e-2
0.79M
0.01
1.0019
1.5881
0.4304
0.7546
0.247
+4.7%
XS_wd1e-2
0.35M
0.01
1.0046
1.5897
0.4369
0.6995
0.305
+4.6%
XS_wd1e-3
0.35M
0.001
1.0047
1.5901
0.4374
0.6968
0.308
+4.6%
XS_wd3e-3
0.35M
0.003
1.0060
1.5923
0.4367
0.6991
0.307
+4.4%
All RMSE in metres on the fixed v23 lat-median val split. rough/smooth = top/bottom tercile of per-tile relief (dem_hi std; p33/p66 = 5.4/16.4 m). gap = val_full − train_full (overfit signal). Green row = current best on rough terrain. v23 baseline (M, wd1e-3): val_full 0.998, rough 1.581, gap 0.241. Driver drivers/smoke/v24_constellation.py.
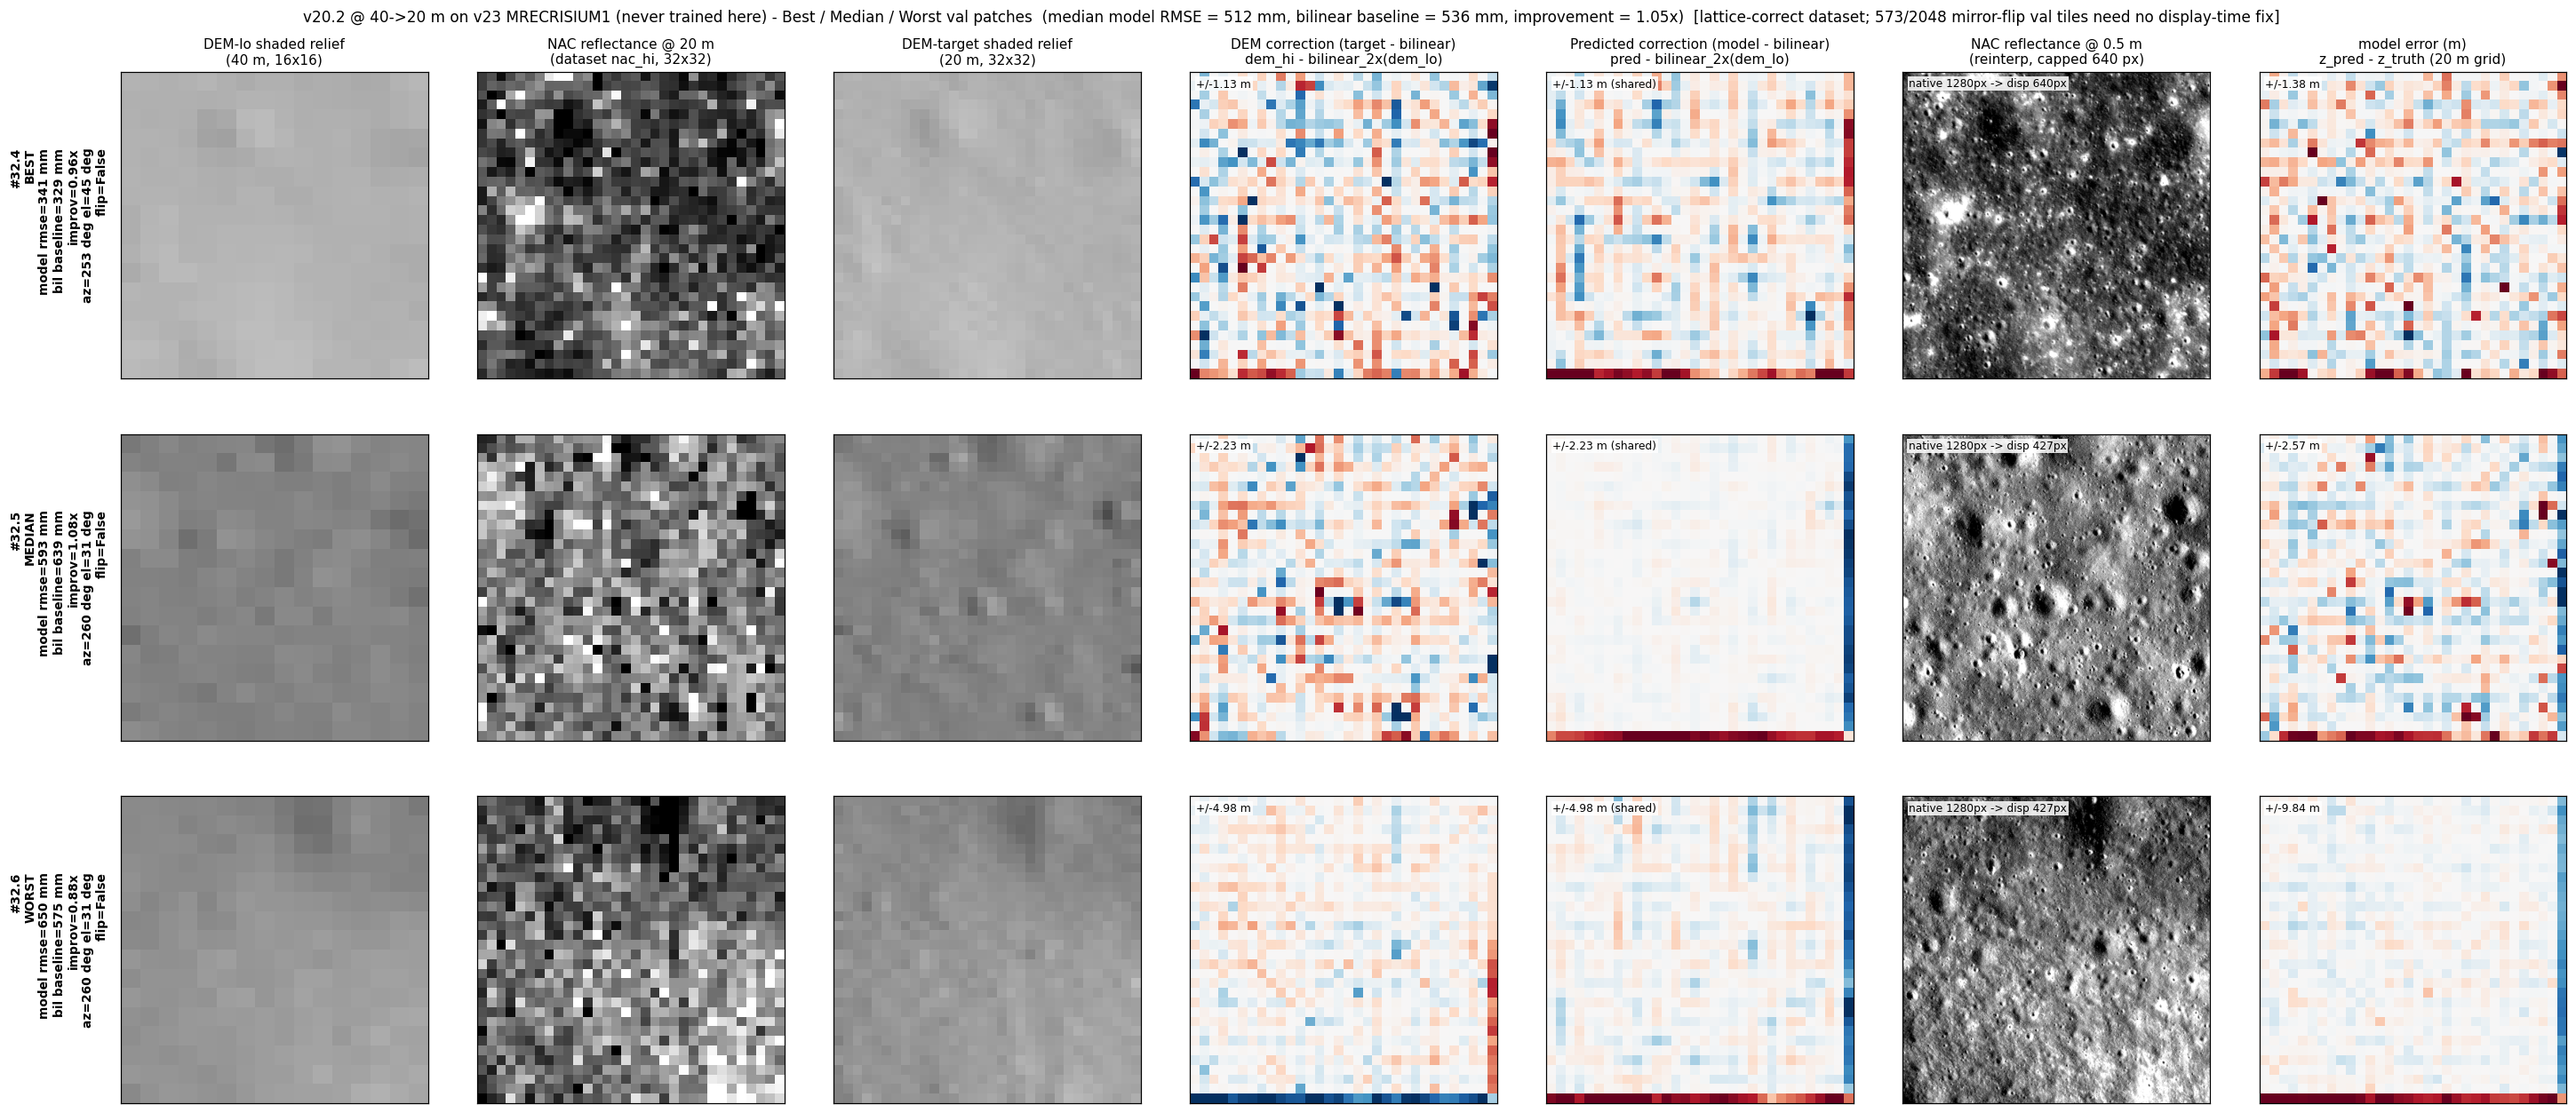
[32.1] v20.2 rerun on v23 training-set examples (MRECRISIUM1, Mare Crisium) updated 34d ago (2026-05-19 23:56)
v20.2 (never trained on this terrain)
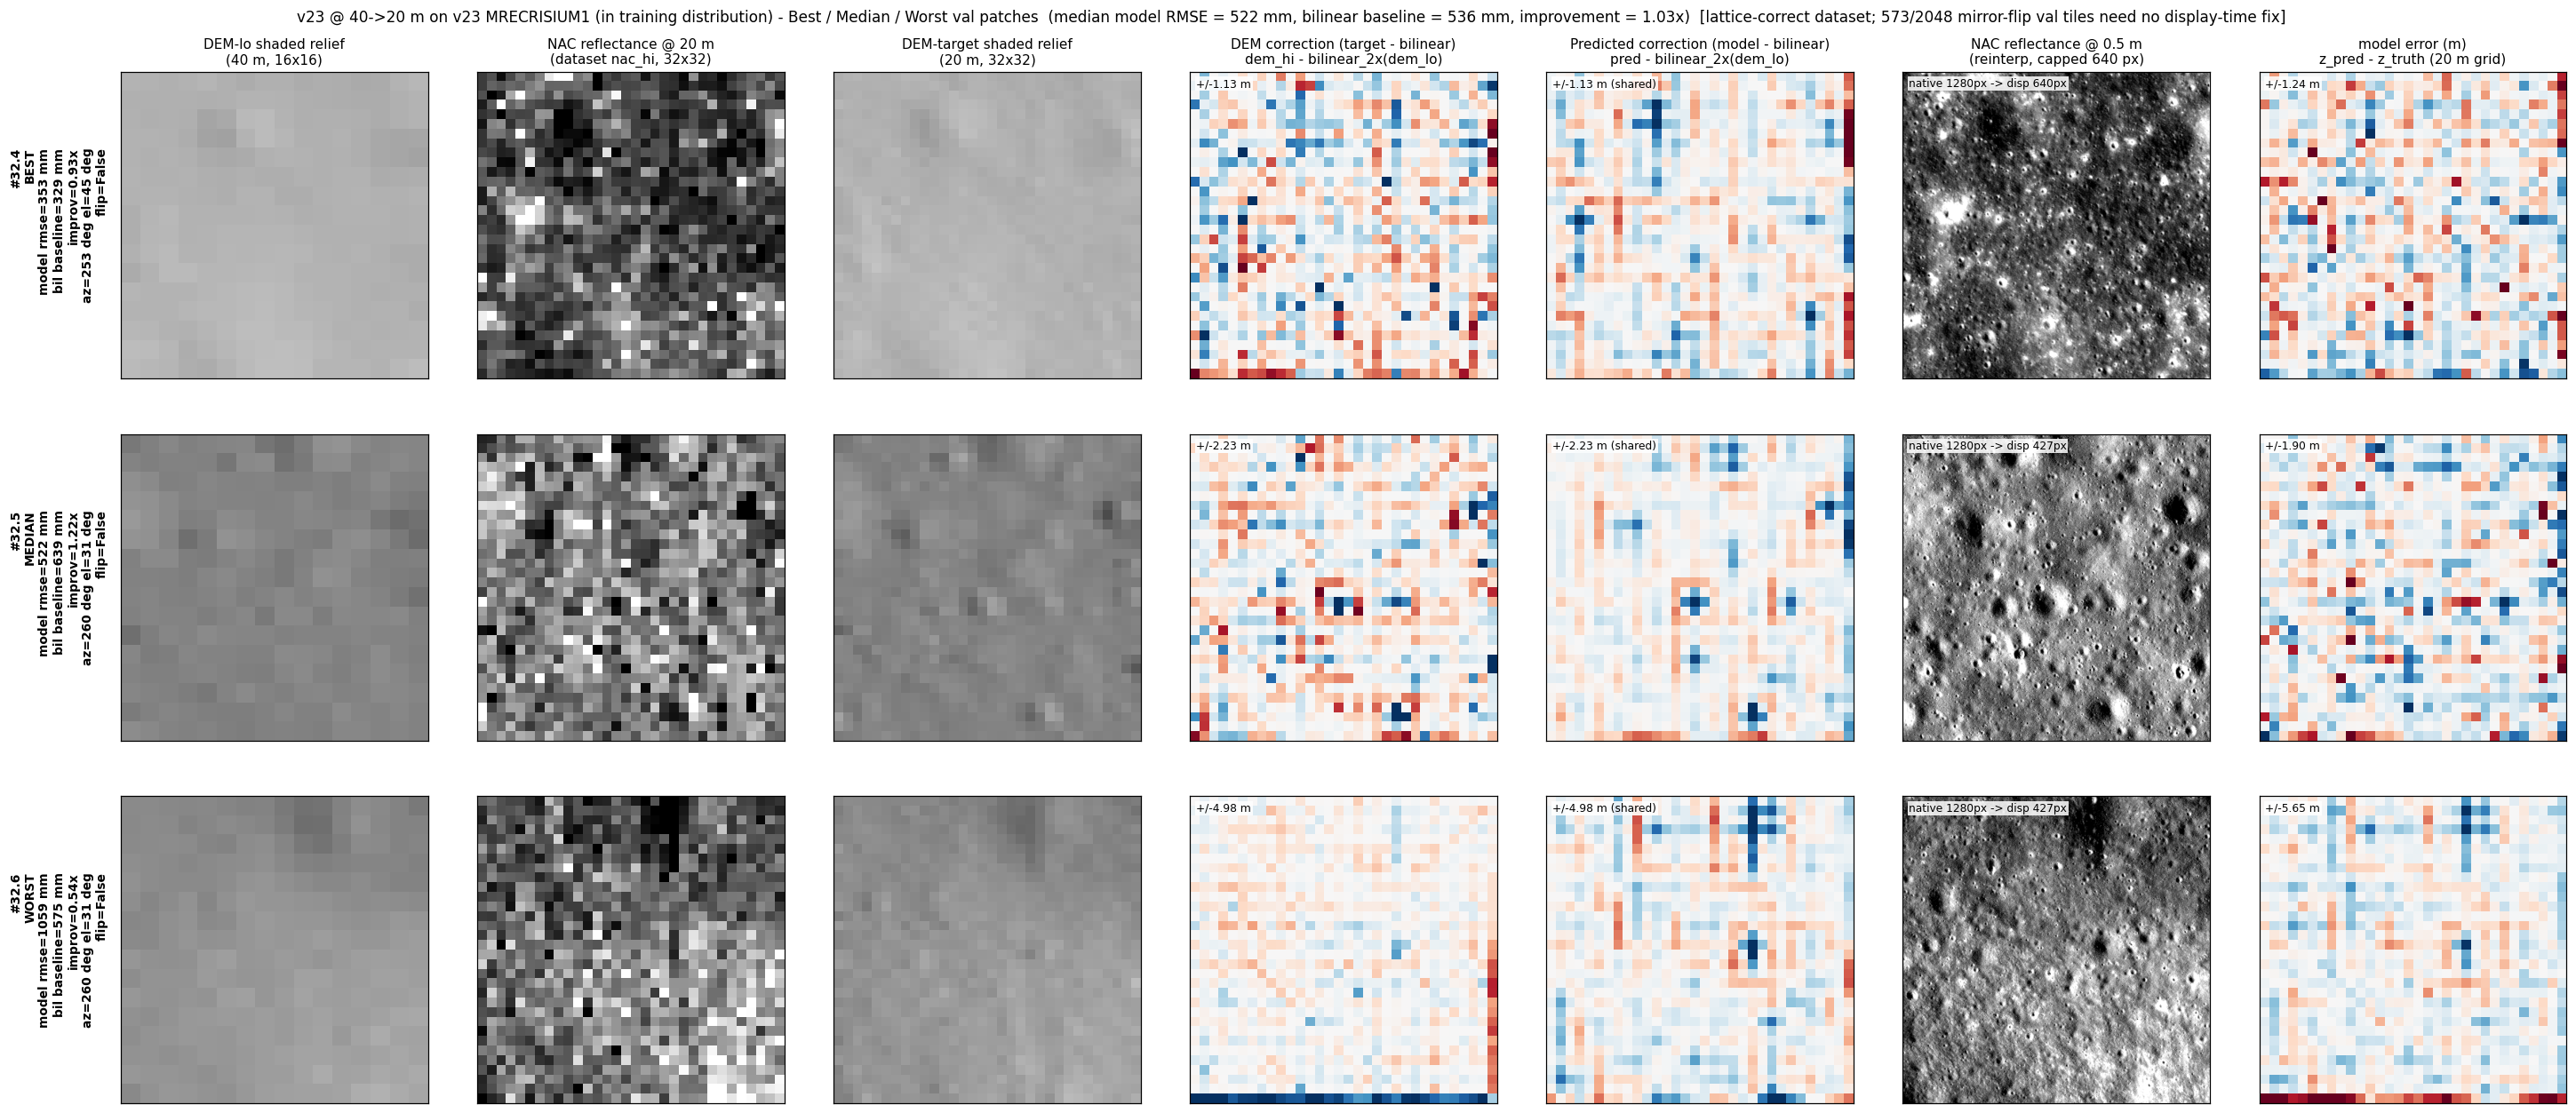
v23 (in training distribution)
Same 3 v23 tiles in both cards (#32.4/.5/.6, v23's best/median/worst on this DTM), so the model-error column (rightmost) is directly comparable. This is Mare Crisium — smooth mare v20.2 never trained on. Both models barely beat bilinear here (v23 1.03×, v20.2 1.05× by central-28 median): smooth mare has little high-frequency signal for either model to add, so bilinear is already near-optimal. The v23 advantage concentrates on rough terrain (Apollo-17) and the error tail, not flat mare. Driver drivers/smoke/v23_examples_card.py.
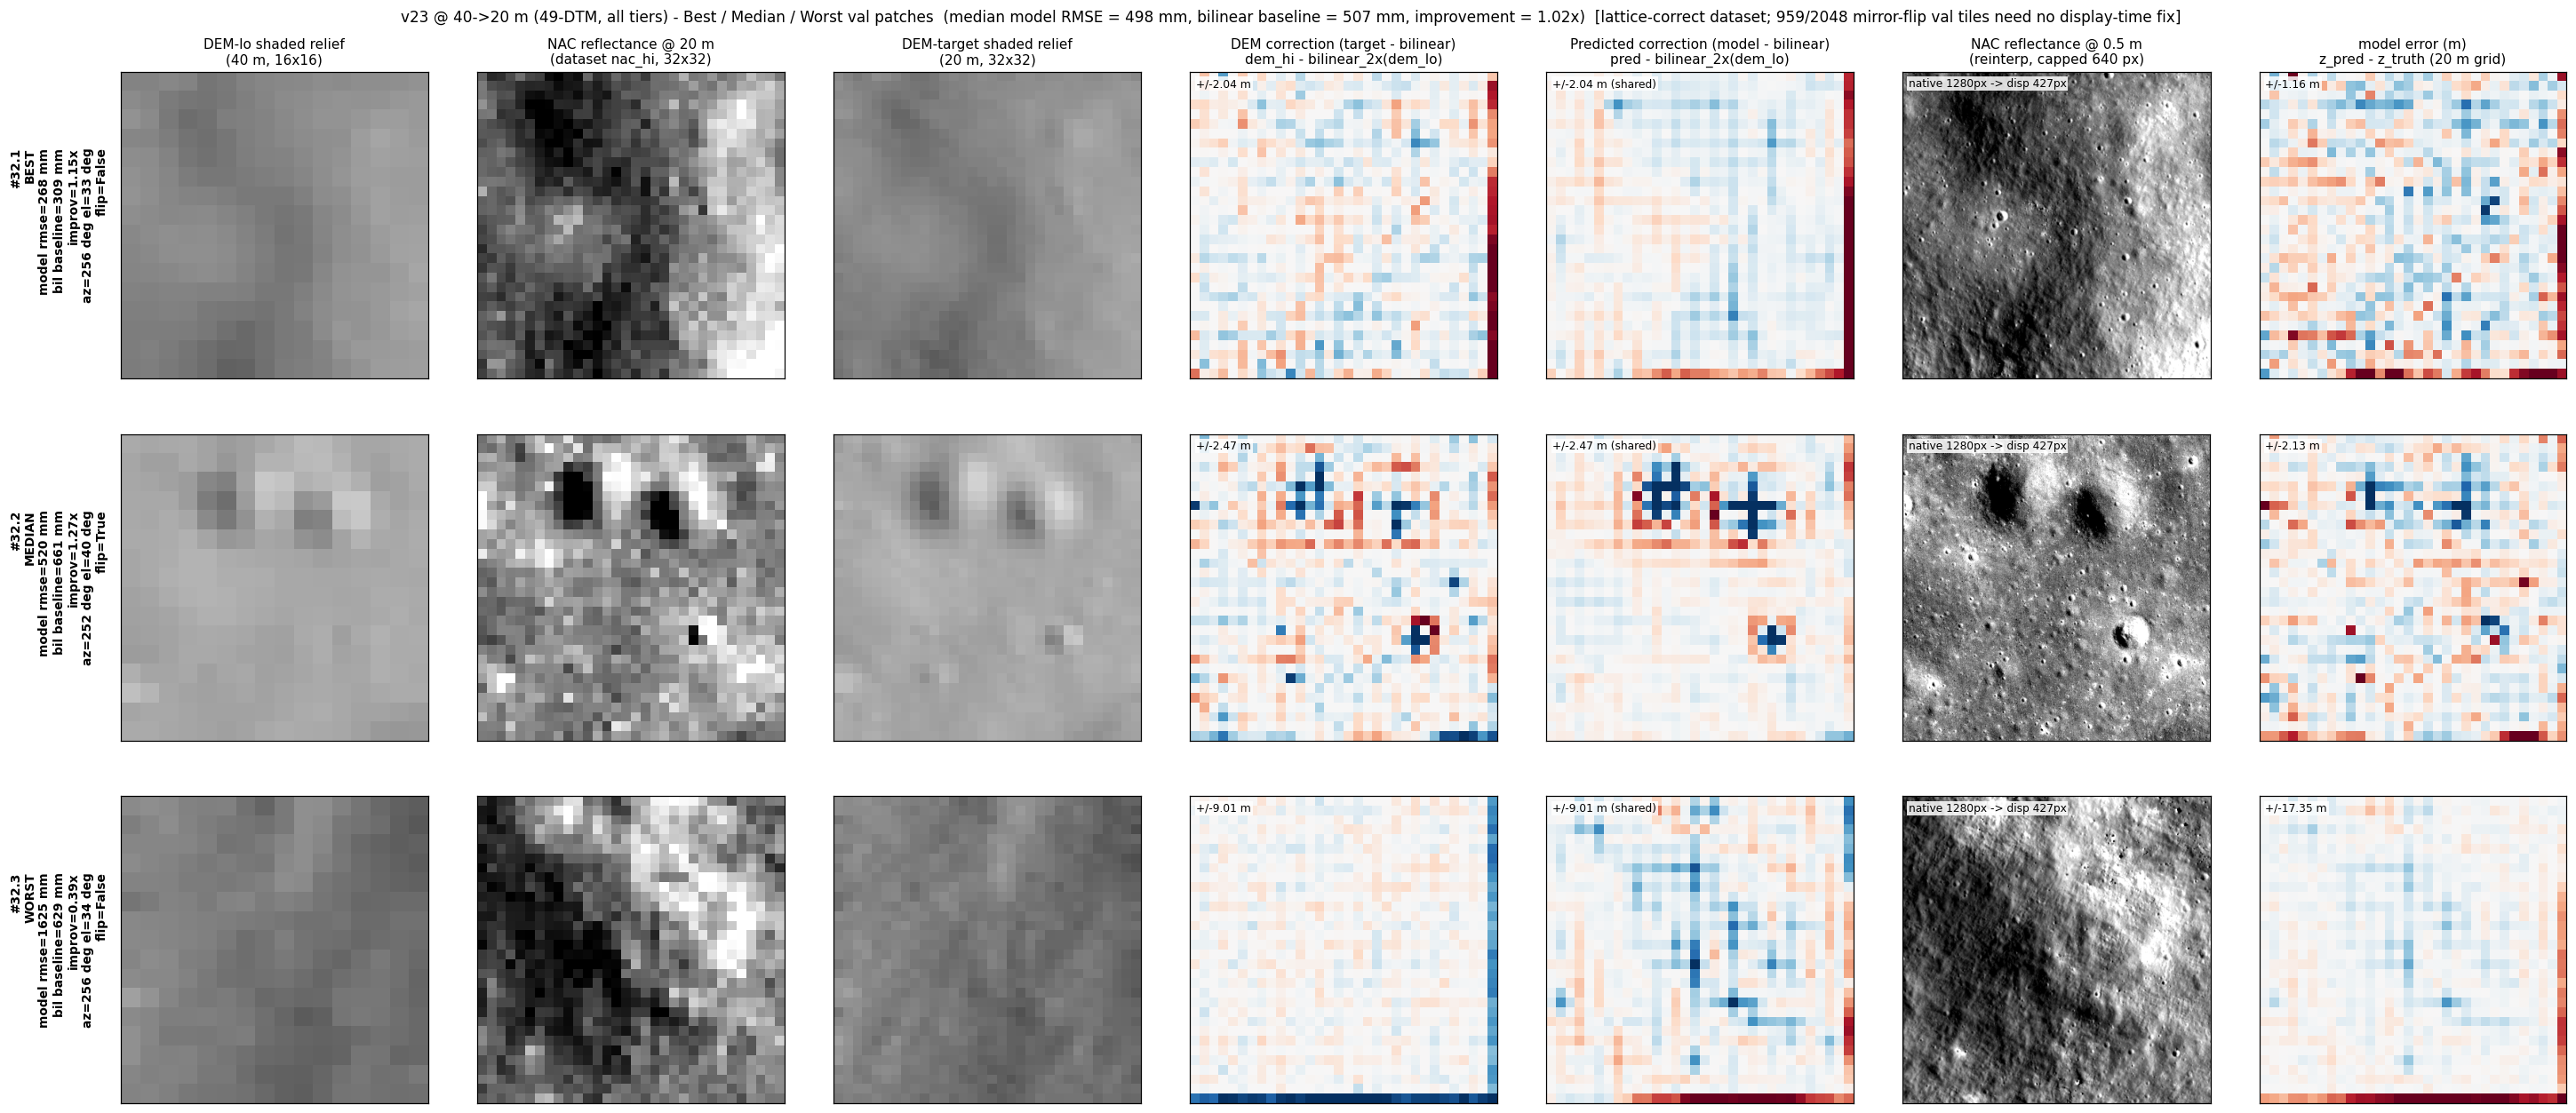
[32.2] v23 vs v20.2 — same v18 test tiles, 7-col error cards (day.number labelled) updated 34d ago (2026-05-19 23:46)
v20.2 (Apollo-17 only)
v23 (49-DTM, all tiers)
Identical 3 v18 test tiles in both cards (the BEST/MEDIAN/WORST tiles the v20.2 @40→20 card selected), so the rightmost model-error column is directly comparable per tile. Tiles are numbered day.number — day = days since the project's first commit (2026-04-18 = day 1); #32.1/.2/.3 here. The SAME number is the SAME physical tile in both cards. Columns: DEM-lo shade (40 m) · NAC (20 m) · DEM-target shade (20 m) · DEM correction (truth−bilinear) · predicted correction (model−bilinear) · NAC @0.5 m · model error (pred−truth). On this v18-pipeline build (v20.2's training distribution) the two models are close, with v20.2 marginally ahead — the mirror of the v23-pipeline result above, confirming the dominant factor is which pipeline built the eval tiles. Driver drivers/smoke/v23_same_tiles_card.py.
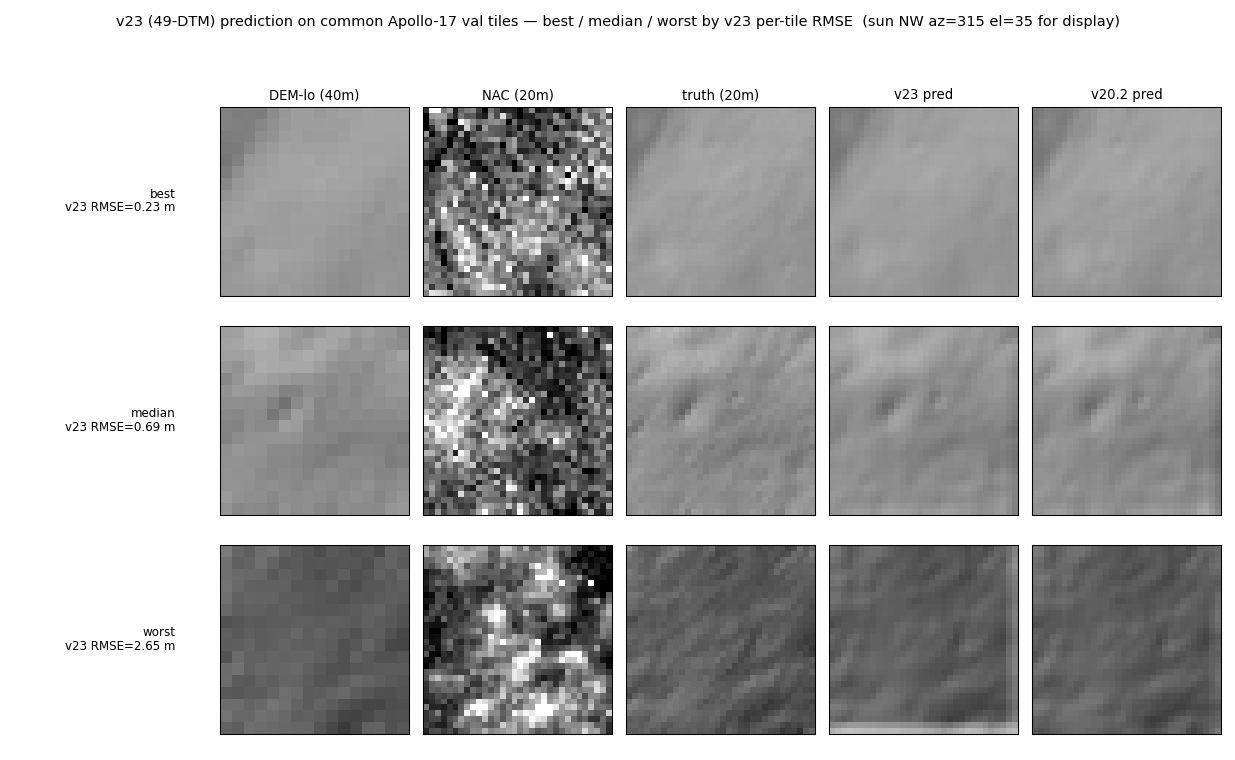
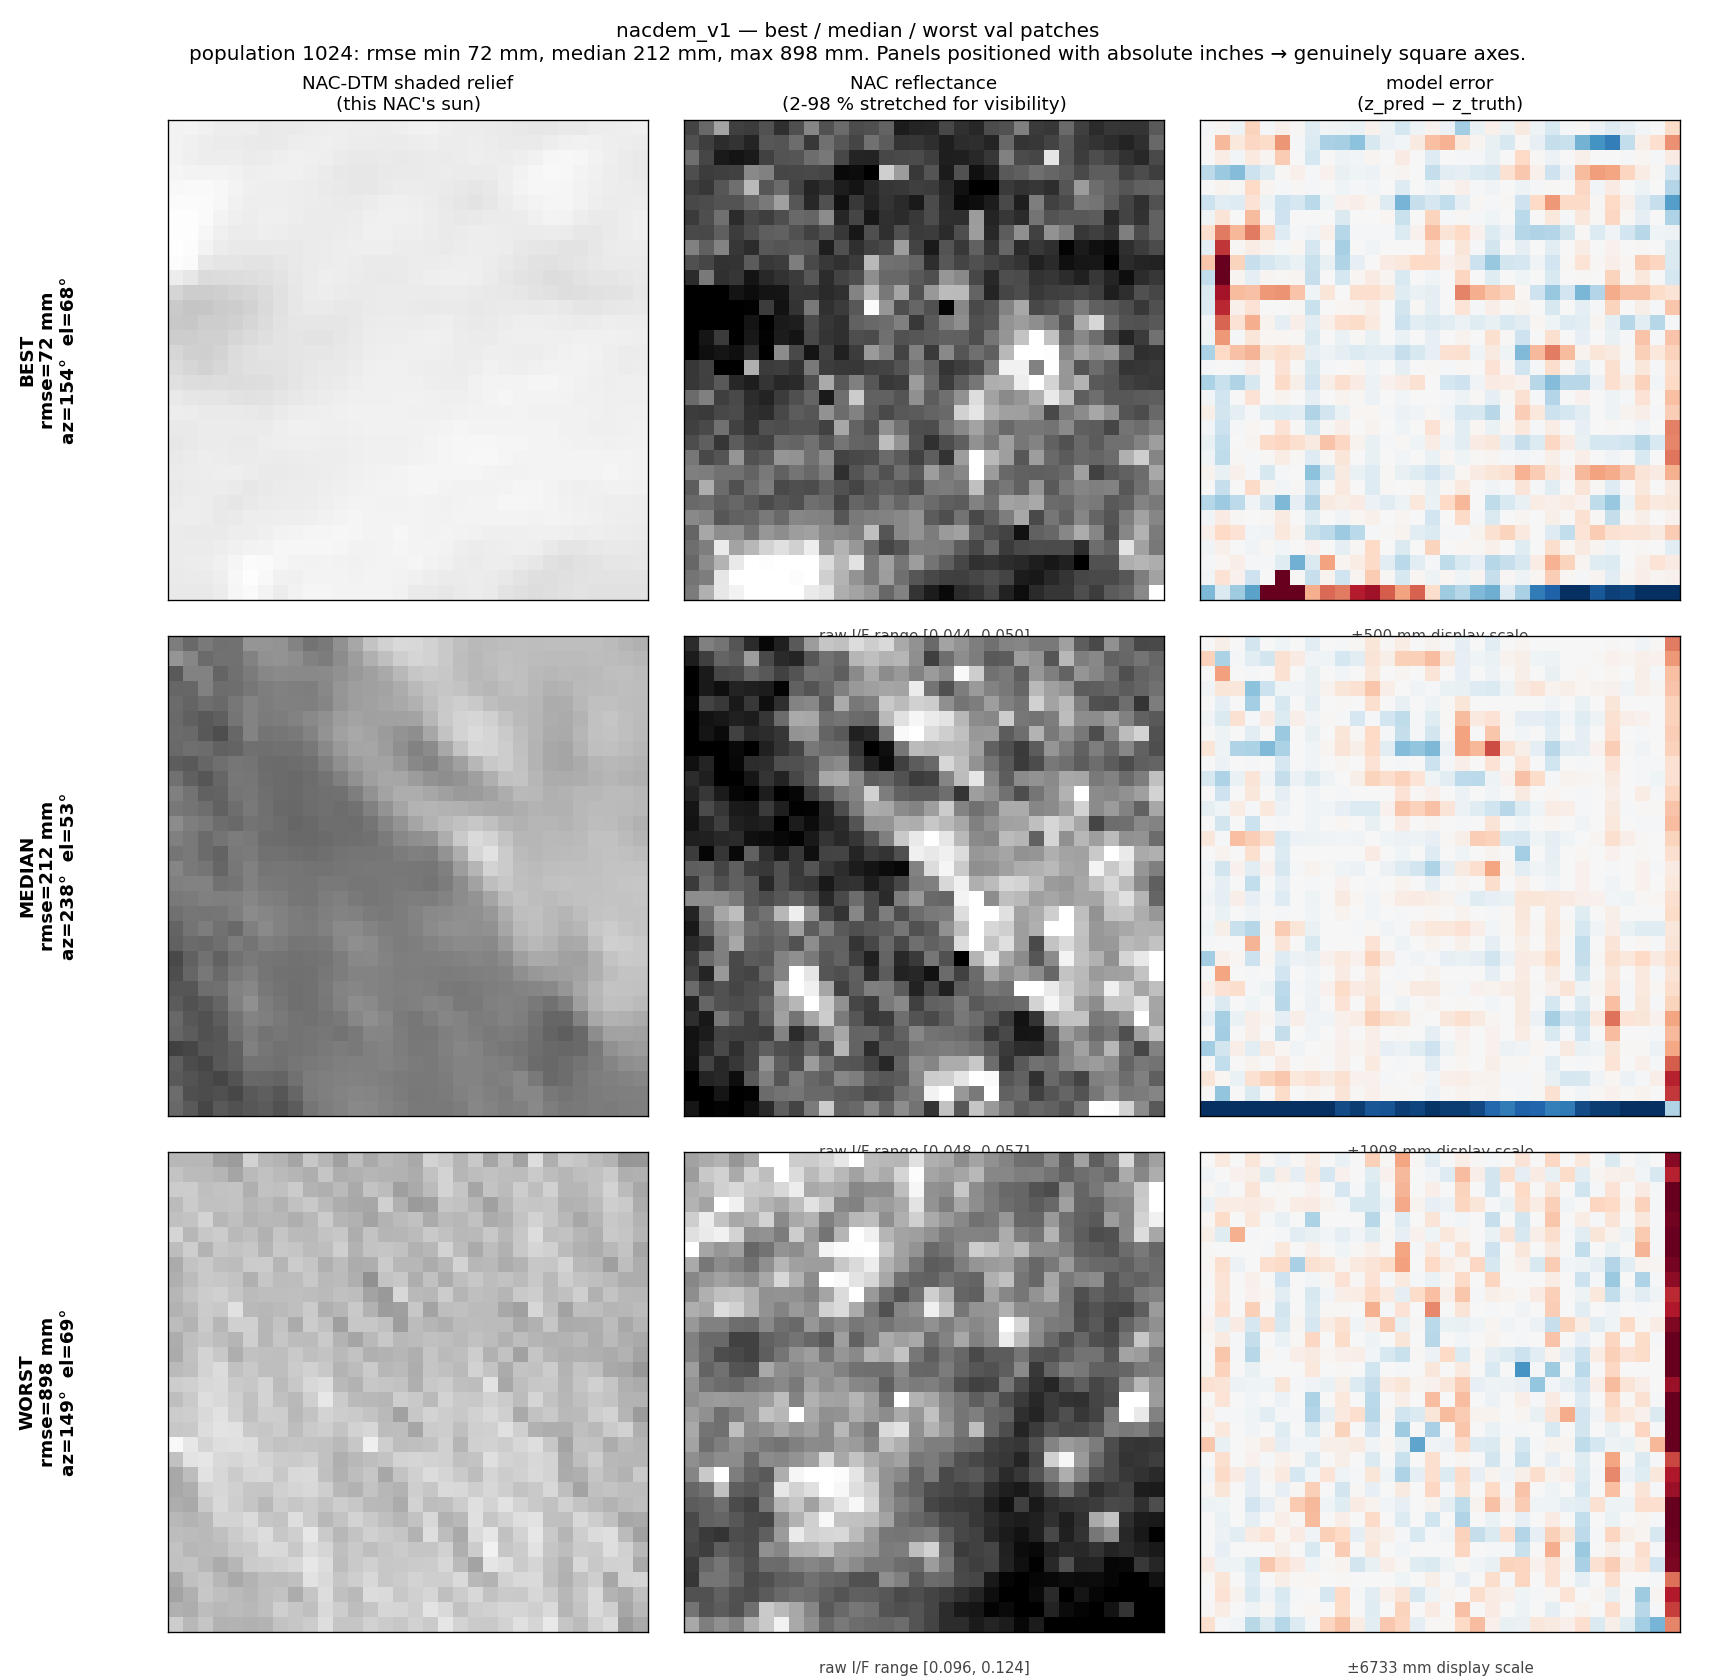
[32.3] v23 (49-DTM) vs v20.2 (Apollo-17 only) — common Apollo-17 val set updated 34d ago (2026-05-19 22:45)
model
pooled RMSE
per-tile median
vs bilinear
v20.2 (Apollo-17 only)
1.142 m
0.875 m
-7.3%
v23 (49 DTMs, all tiers)
0.898 m
0.689 m
+15.6%
14,274 leakage-free Apollo-17 val tiles (lat ≤ 19.934, the v23 global split — held out of both models; also below Apollo-17's own median so val-side for v20.2). Identical tile set and bilinear baseline (1.064 m) for both. v23 beats v20.2 by ~21% and clears bilinear by ~16%; v20.2 does NOT beat bilinear on held-out Apollo-17 terrain — the broad-terrain model generalizes better than the Apollo-17 specialist. Caveat: v20.2 trained on the v18-pipeline build, evaluated here on v23-pipeline tiles (some distribution shift); the shared bilinear baseline is the pipeline-neutral anchor. Image: best/median/worst tiles by v23 per-tile RMSE (shaded relief, NW sun). Driver drivers/smoke/v23_vs_v20_apollo17.py.
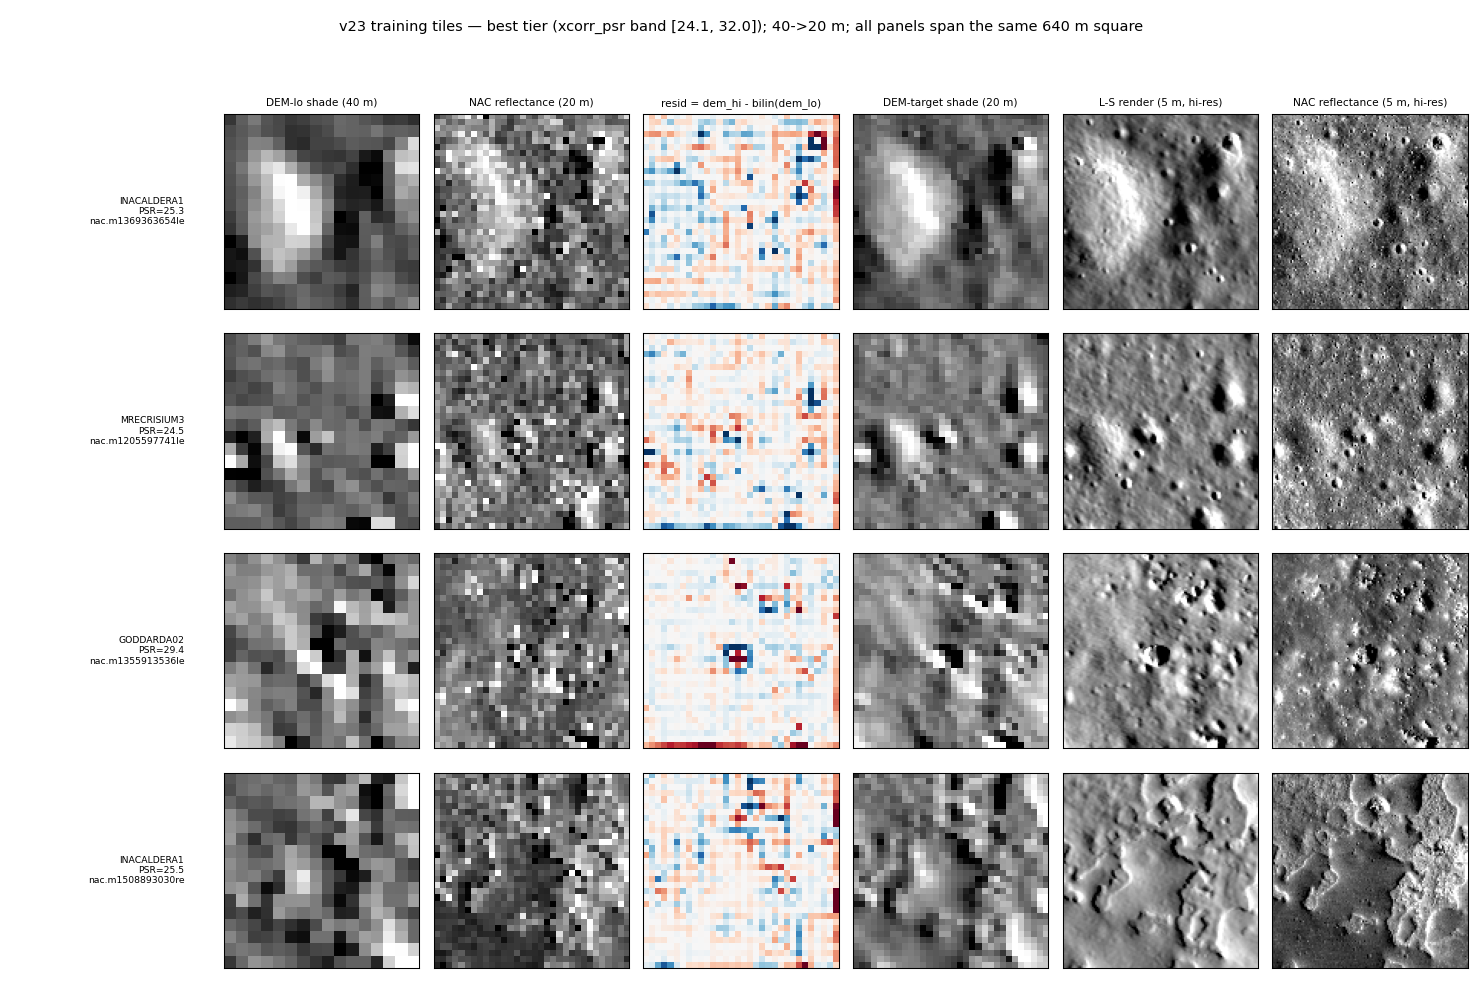
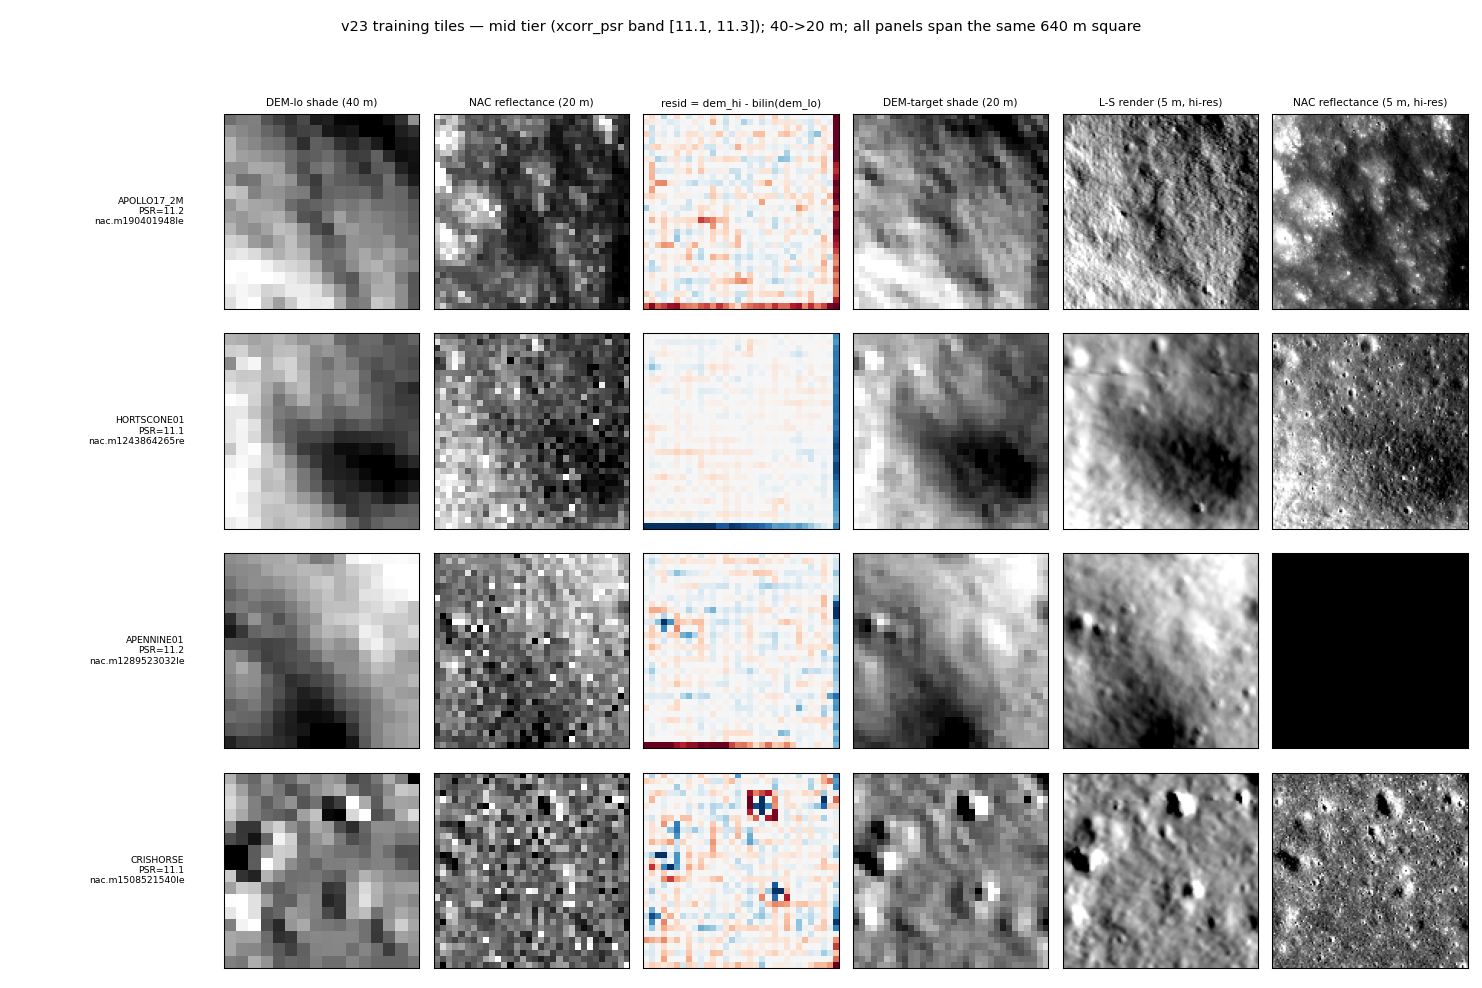
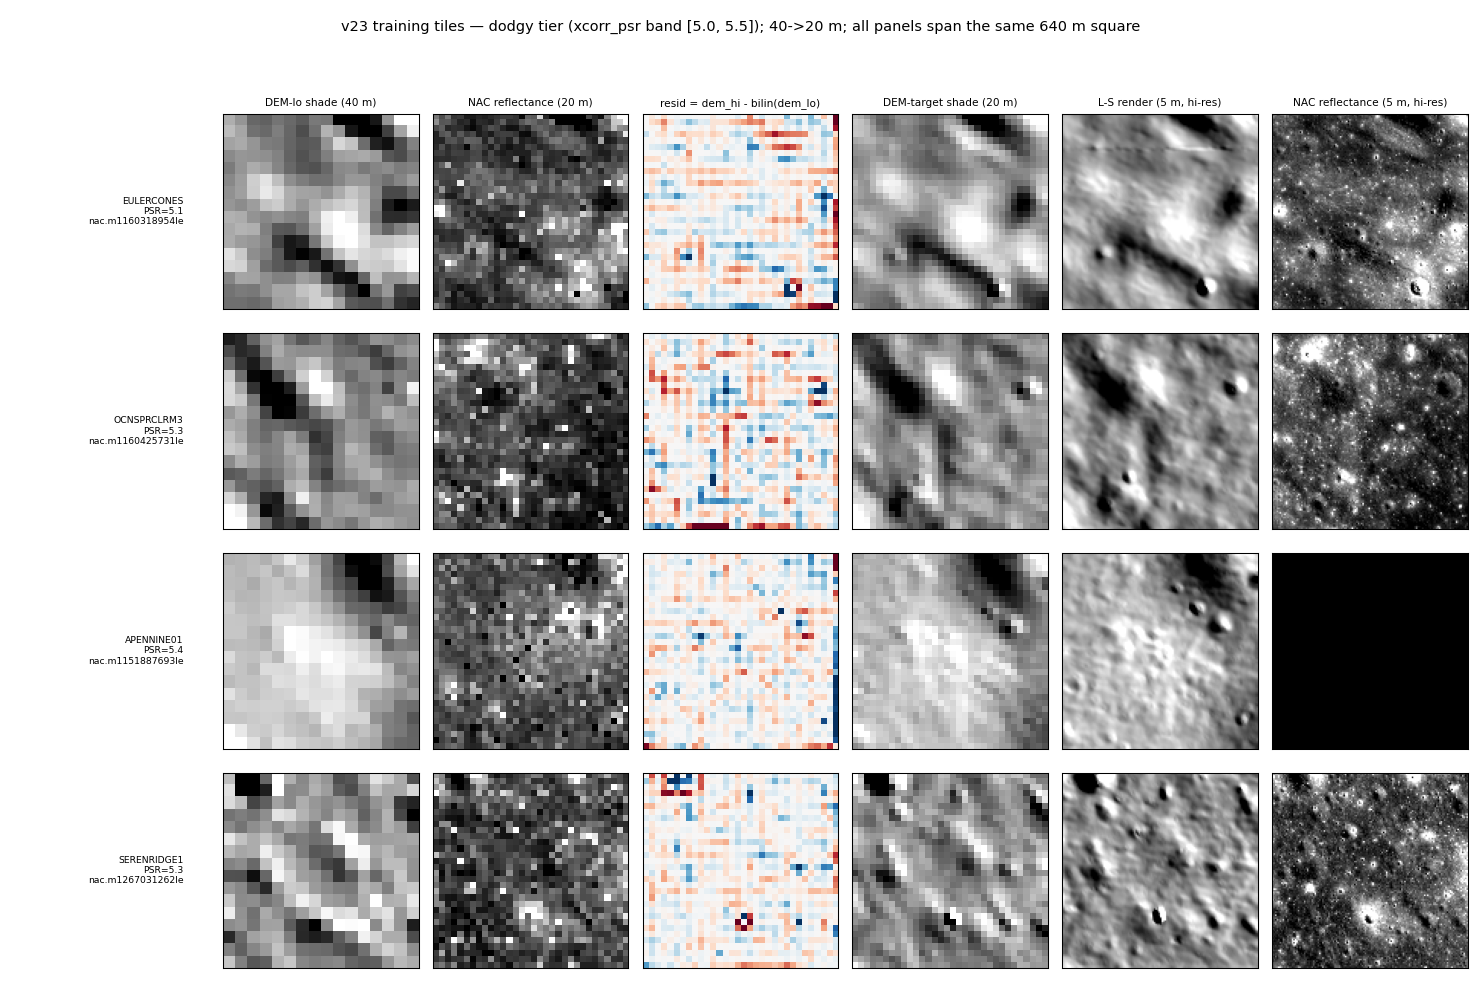
[32.4] v23 training-tile quality tiers (best / mid / dodgy by xcorr_psr) updated 34d ago (2026-05-19 21:33)
BEST — top 1% PSR band
MID — median PSR band
DODGY — bottom 2% (just above the PSR≥5 build gate)
4 example tiles per tier, drawn from percentile bands of the per-tile xcorr_psr (phase-correlation peak-to-sidelobe ratio — the terrain-invariant alignment metric build_shard gates on). Six panels per tile, every box rendered over the same 640 m square so all are uniform size: (1) DEM-lo shaded relief (40 m) · (2) NAC reflectance the model sees (20 m) · (3) signed bilinear residual (dem_hi − bilinear(dem_lo), ±p99) · (4) DEM-target shaded relief (20 m) · (5) highest-res L-S render (5 m truth) · (6) highest-res NAC reflectance (5 m), sampled the same way build_shard samples the model input (reinterp_nac_raw_at_grid_gpu with the per-NAC realign field + cam2map LUT + mirror). Cols 1–4 come straight from the shard arrays; cols 5–6 from the truth DTM + faithful NAC reinterp. All lit by each tile's own sun_az/el. High-PSR tiles show crisp crater co-registration between the L-S render (col 5) and the NAC (col 6); dodgy tiles show grainy/low-contrast NAC and busy residuals. Driver drivers/smoke/v23_tier_examples.py.
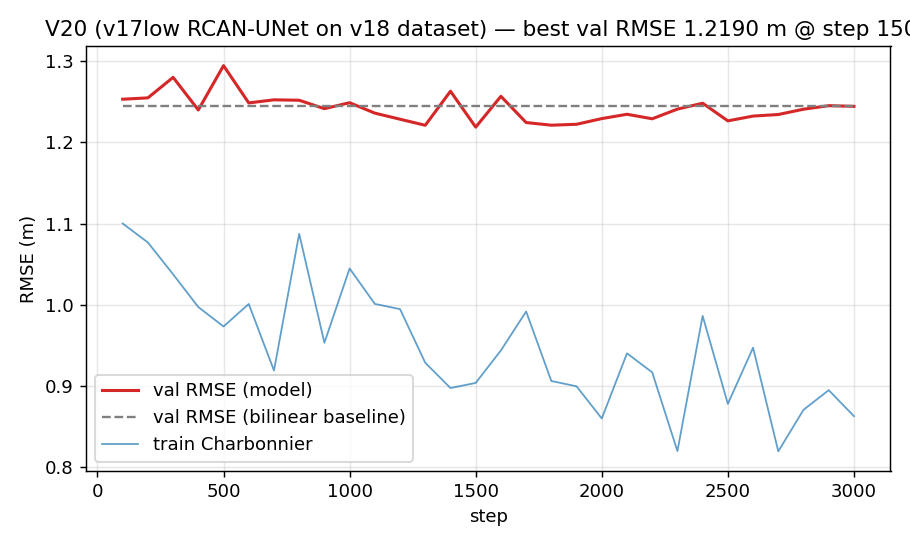
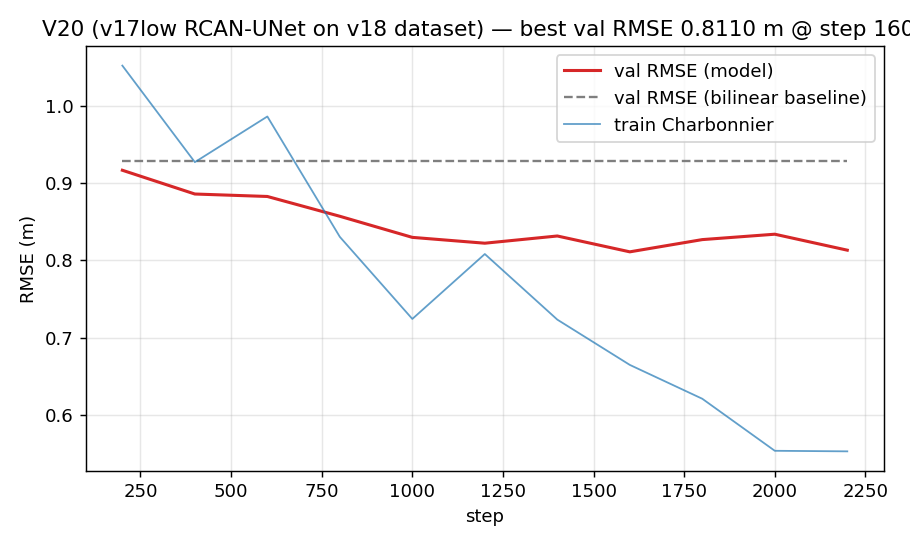
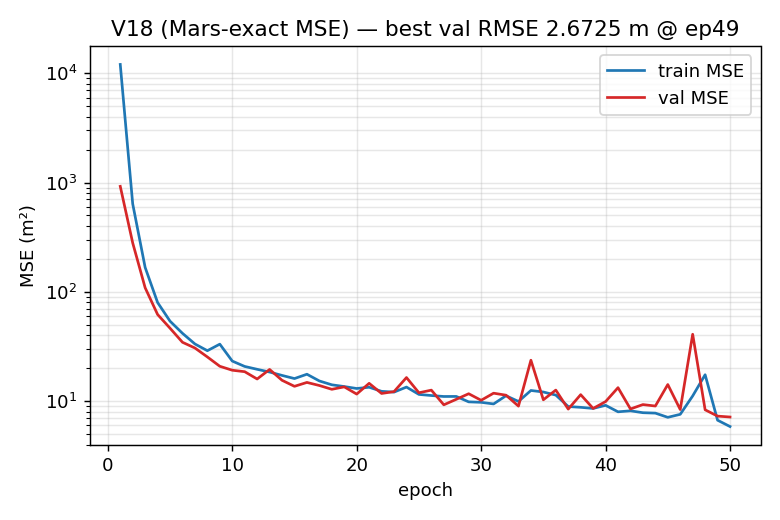
[32.5] nacdem_v23 SMOKE training curve (40 m -> 20 m, 3 k steps) updated 34d ago (2026-05-19 15:27)
Best val RMSE 1.219 m at step 1500; trained on 78,235 tiles from 20 HQ DTMs (med xcorr_psr ≥ 10) in 74s on RTX 5090. Val RMSE (red) vs sample-preserving bilinear baseline (grey dashed) vs train Charbonnier (blue). Convergence sanity check on the v23 mid-build dataset; 171 corrupt tiles filtered out (CRISHORSE / CRISHORSE02 had NaN→0 fill near DTM edges). Drivers drivers/smoke/v23_merge_smoke.py + steps/S18_pix2pix_dem/impl/train_v20.py.
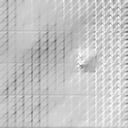
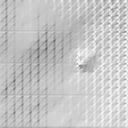
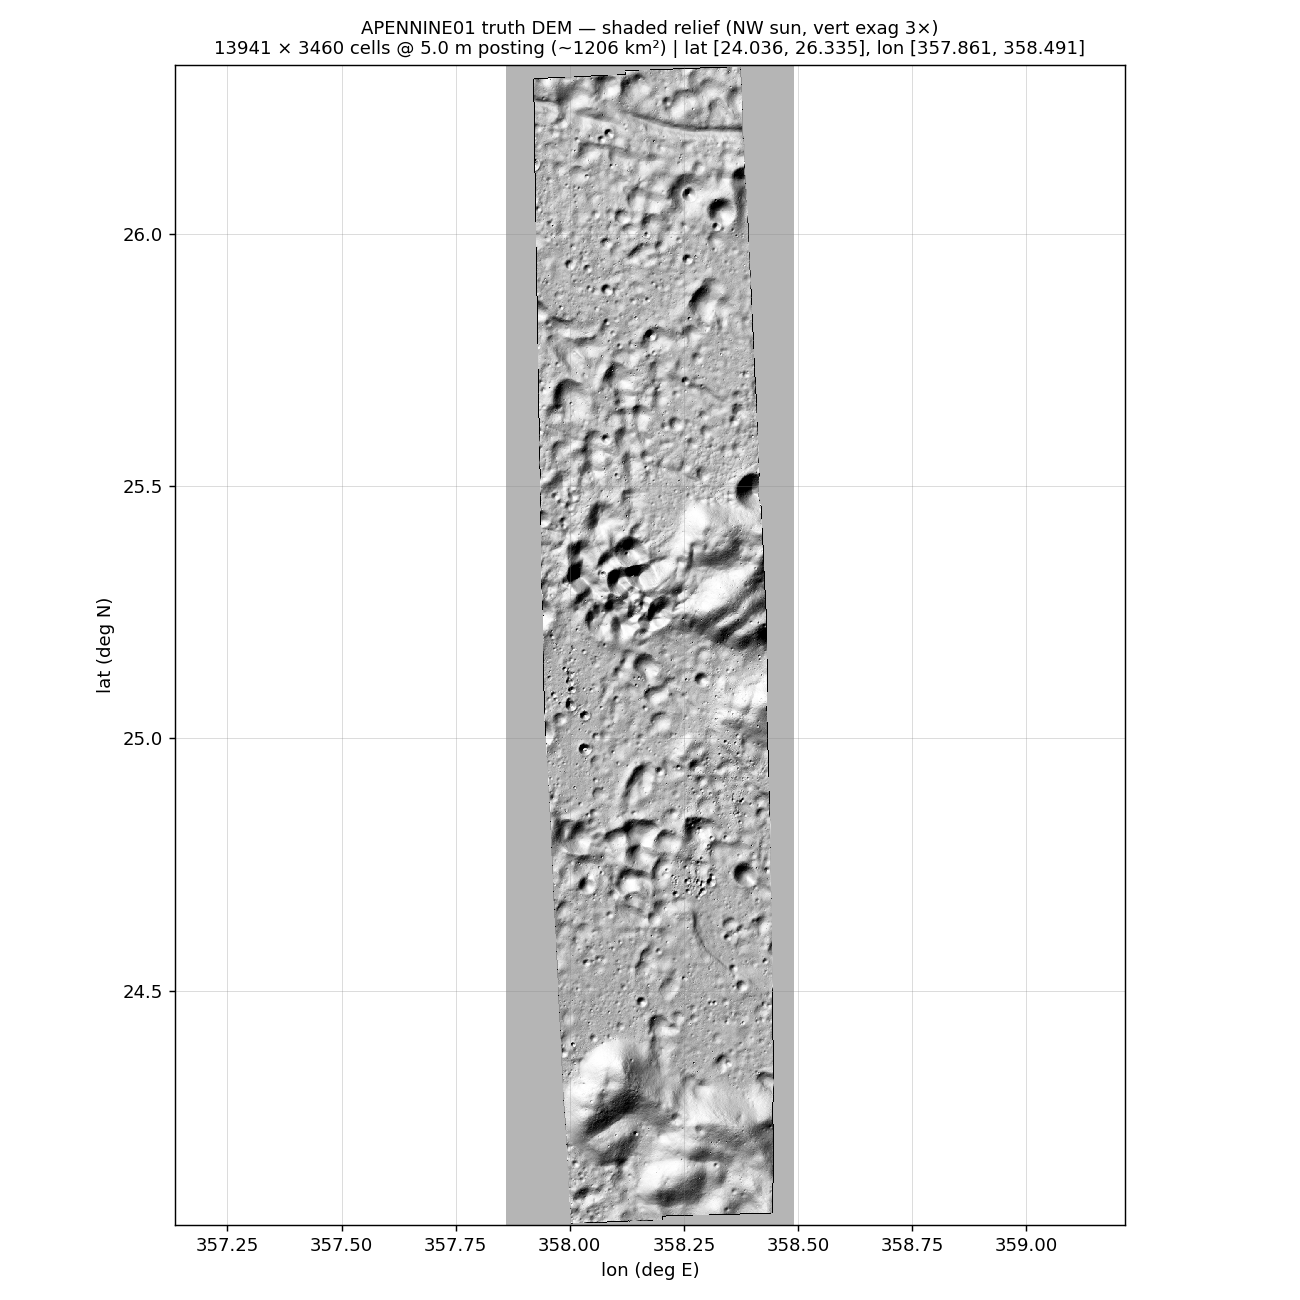
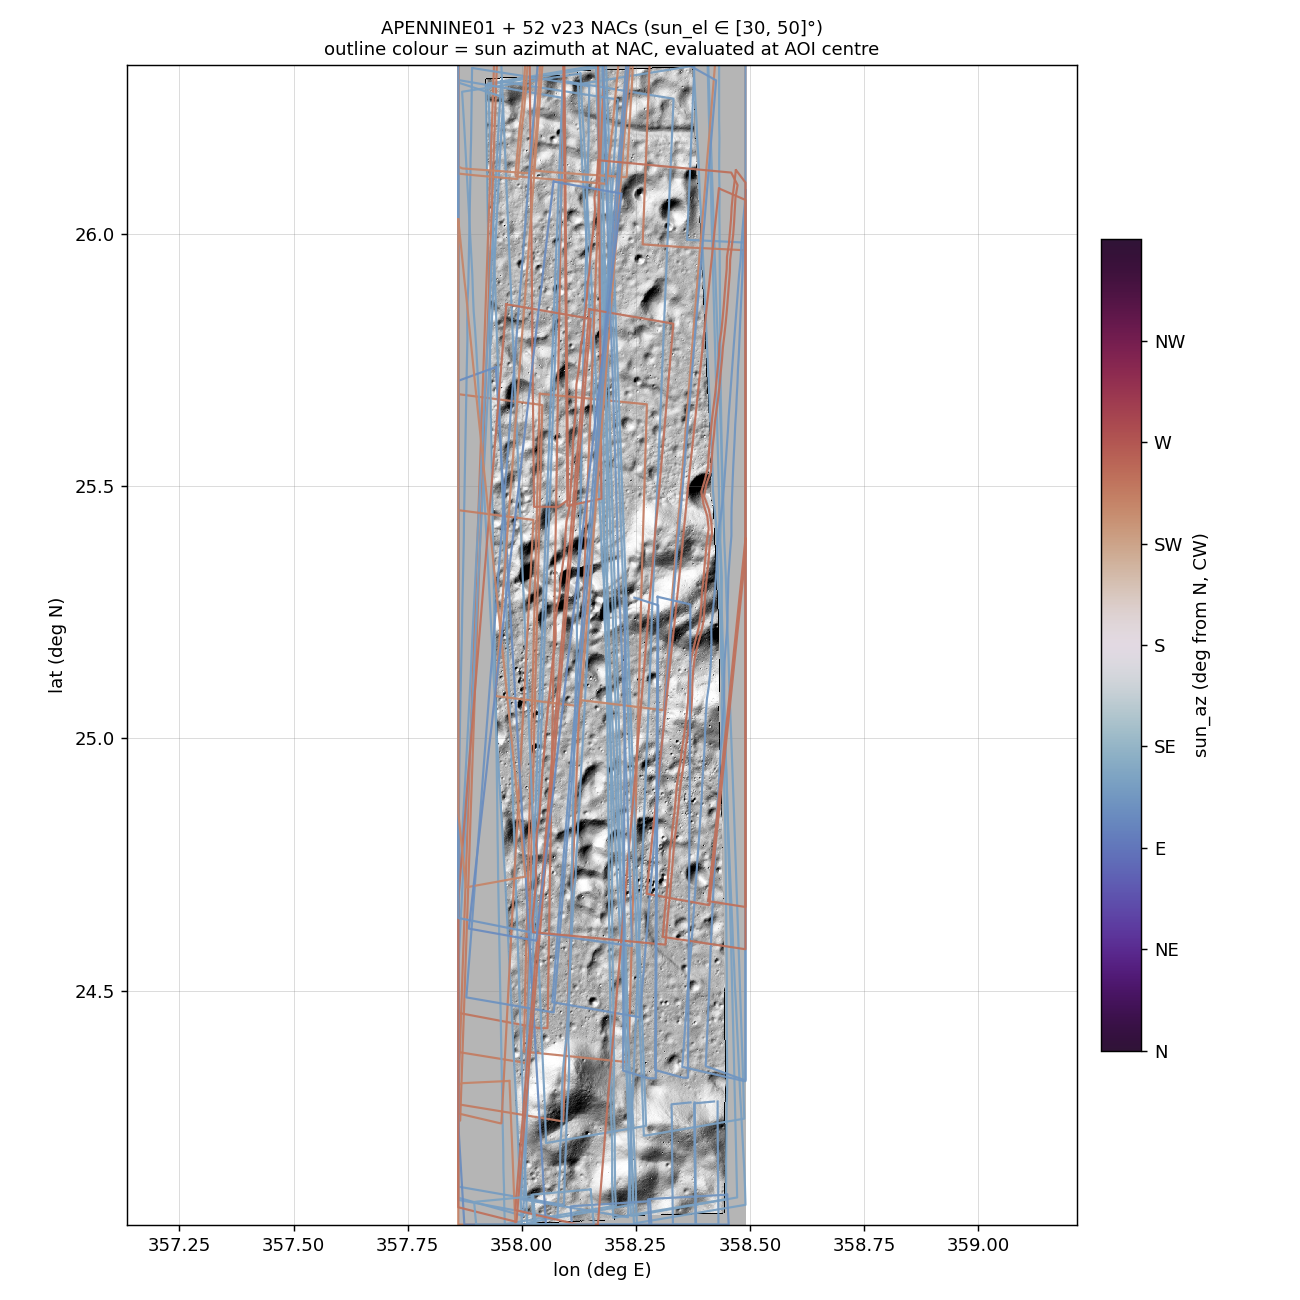
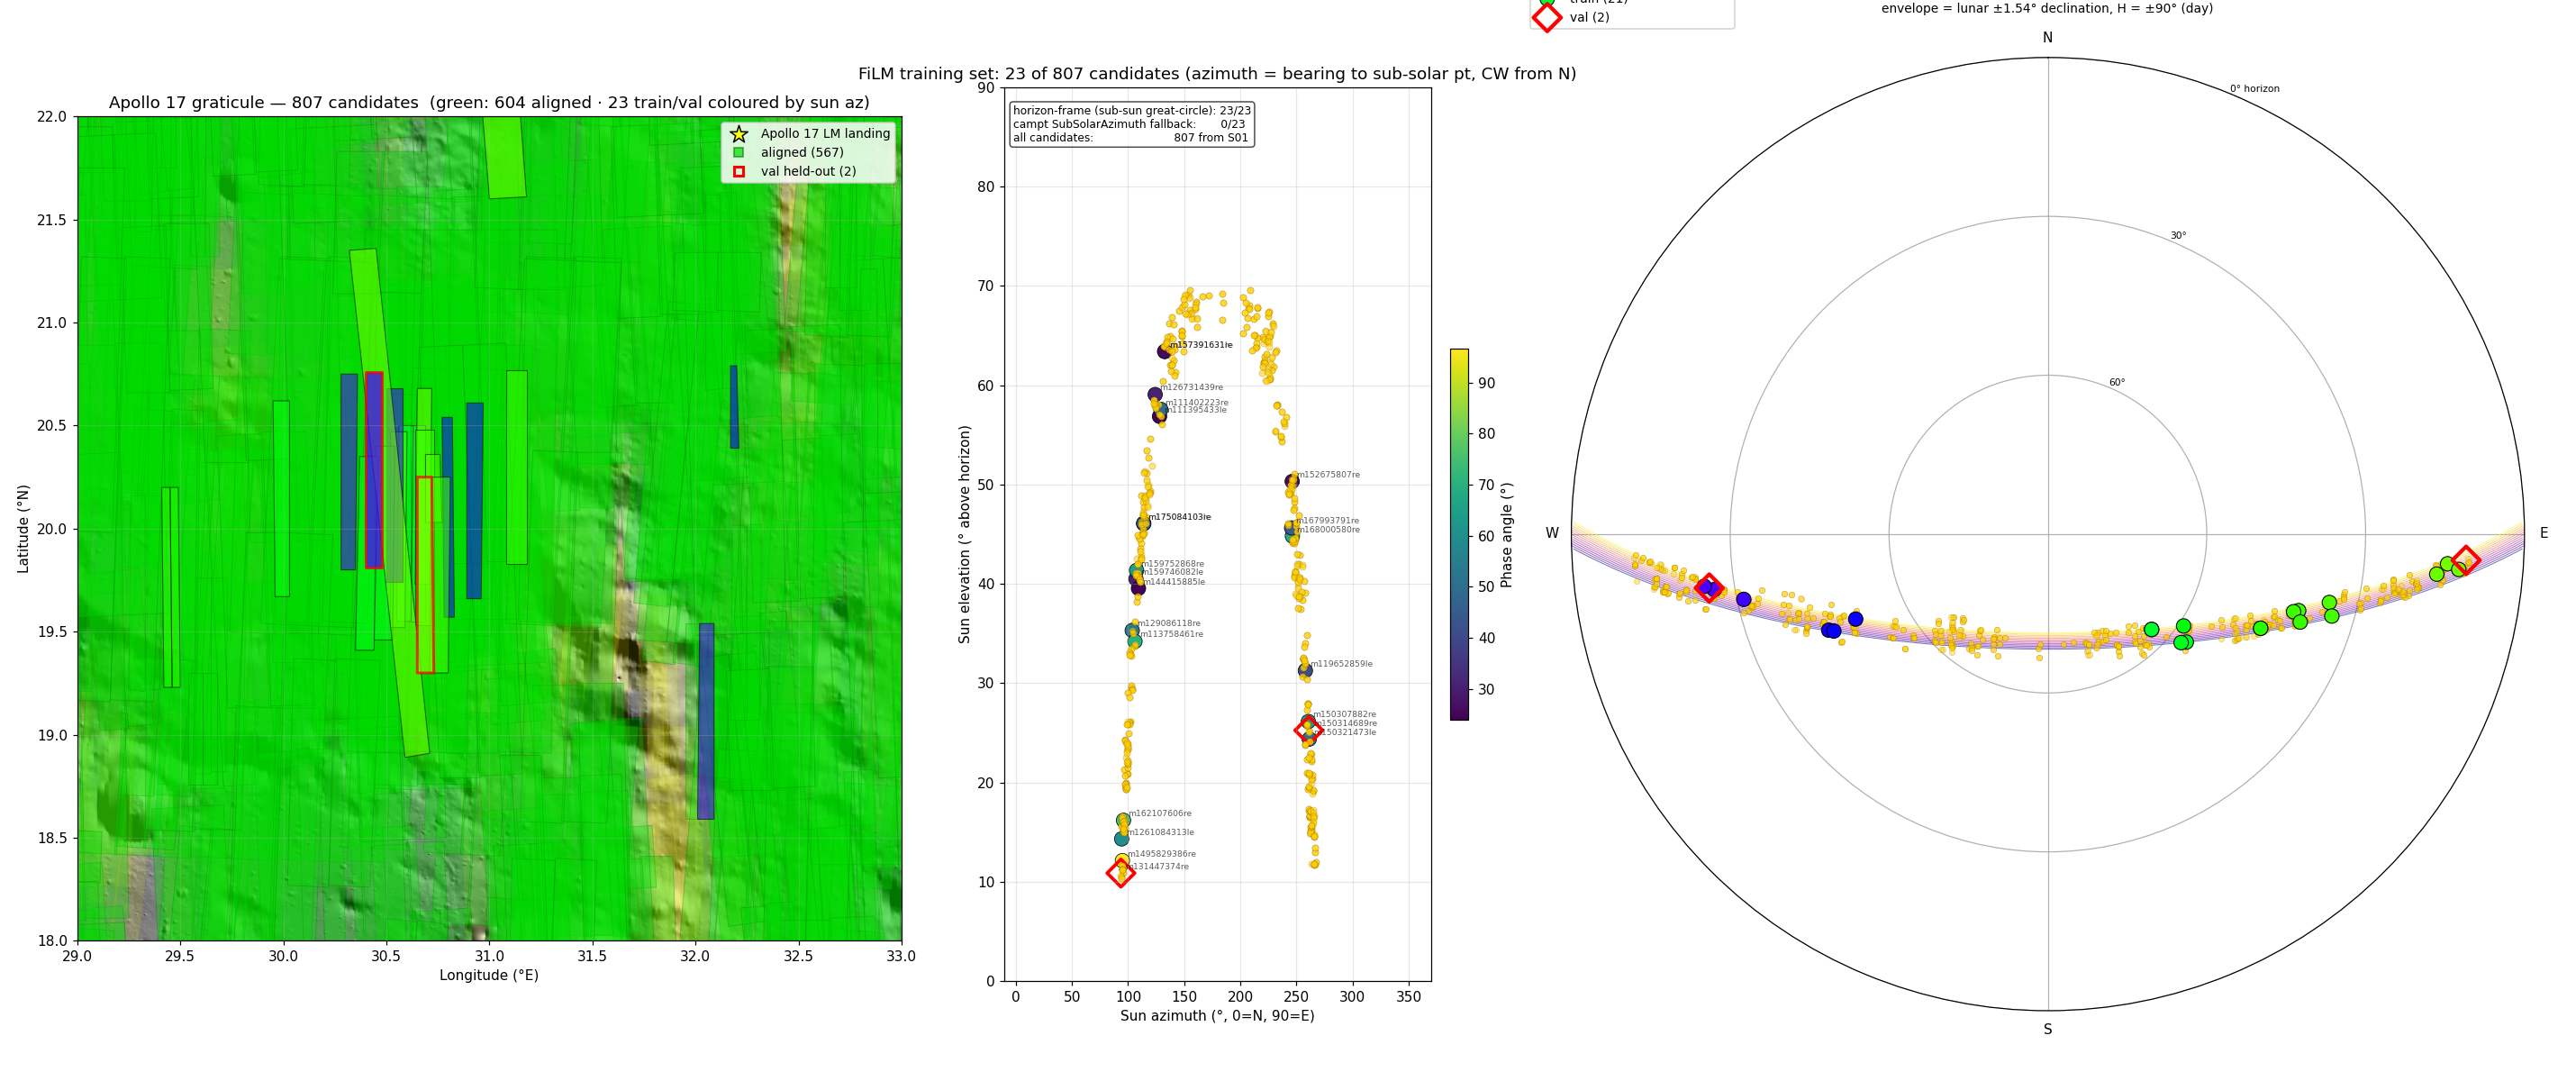
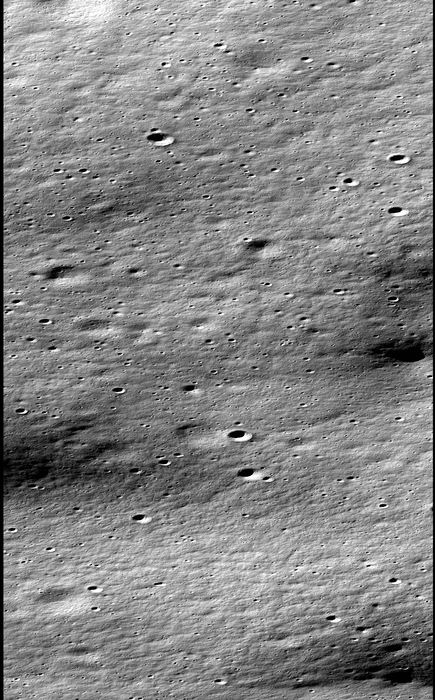
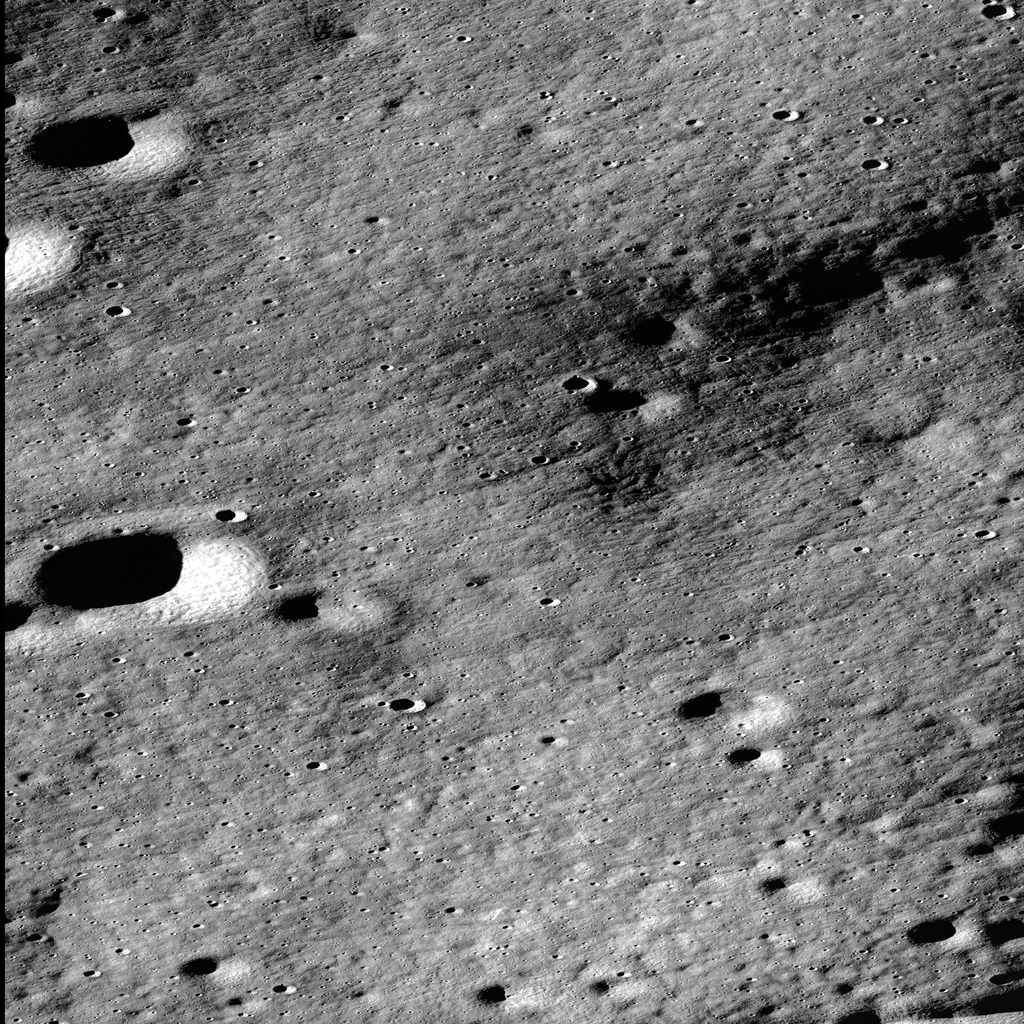
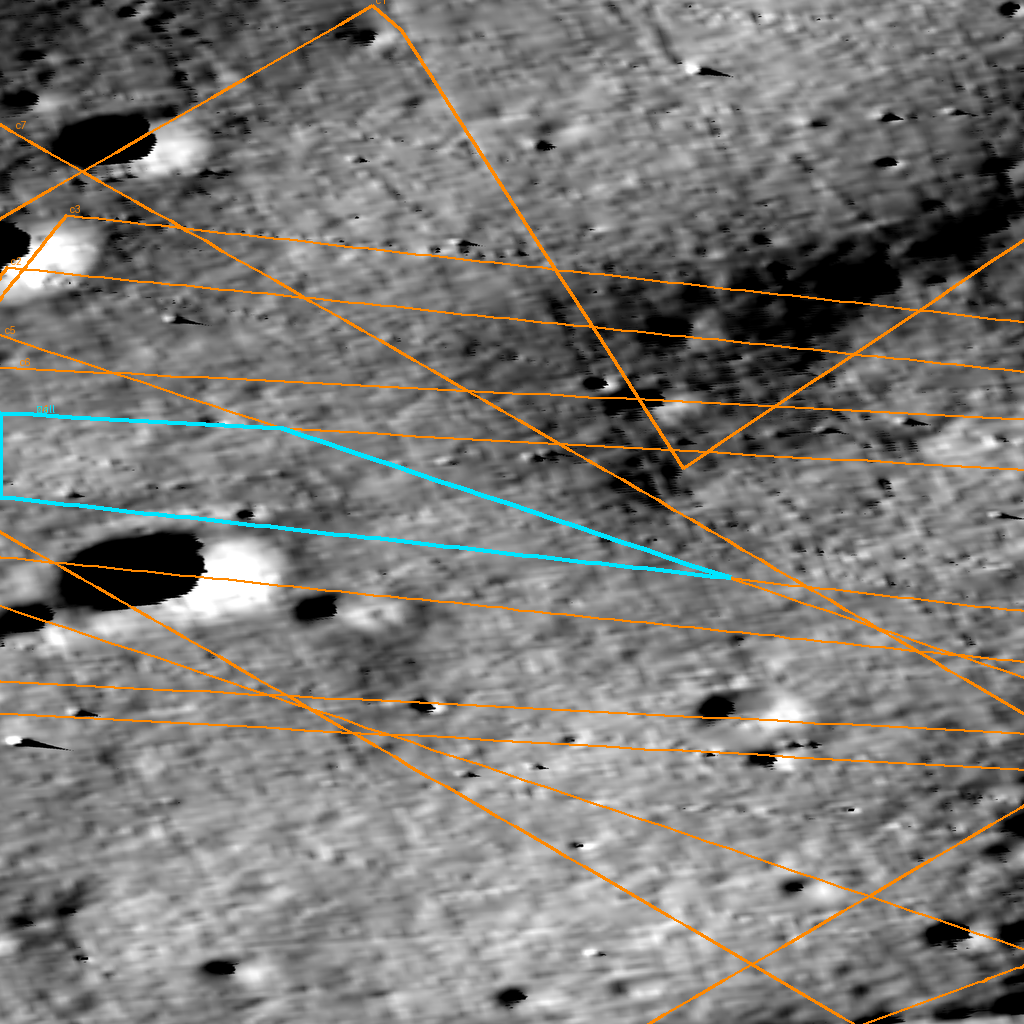
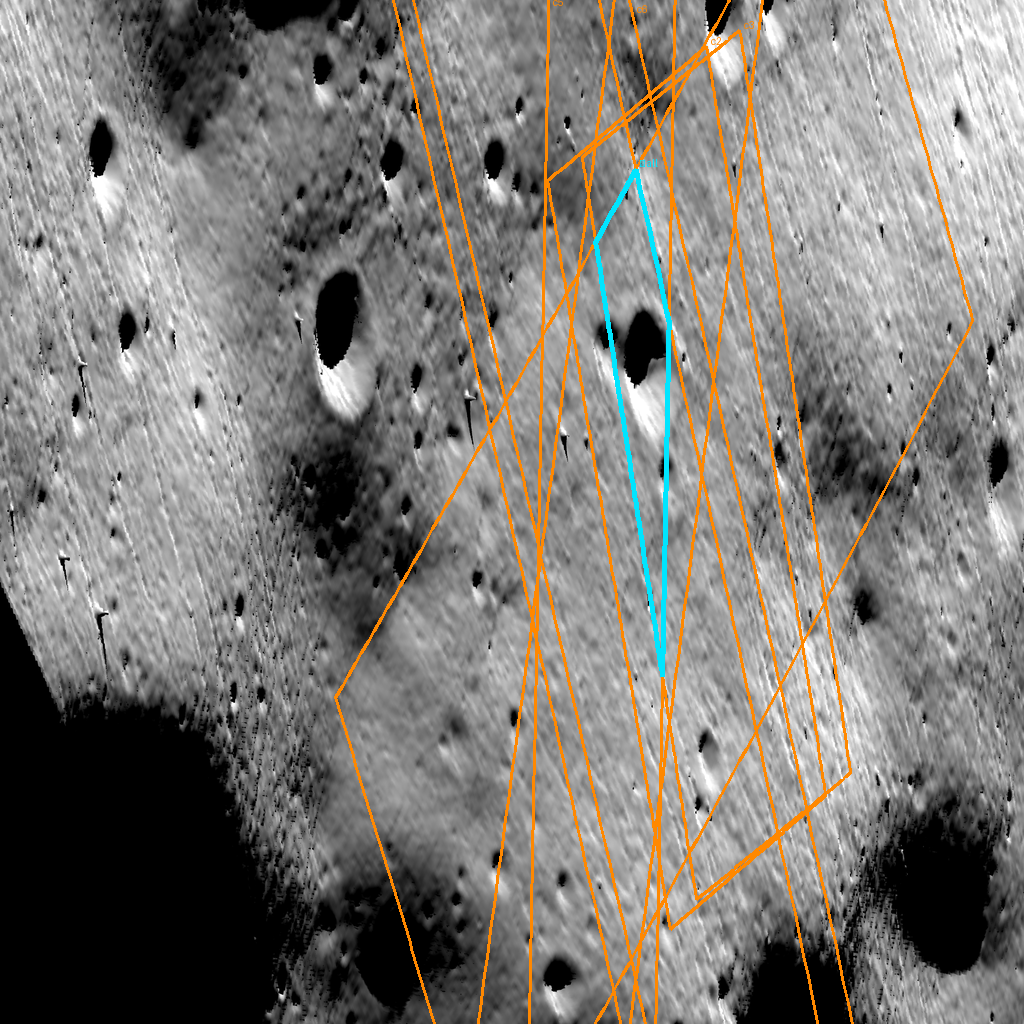
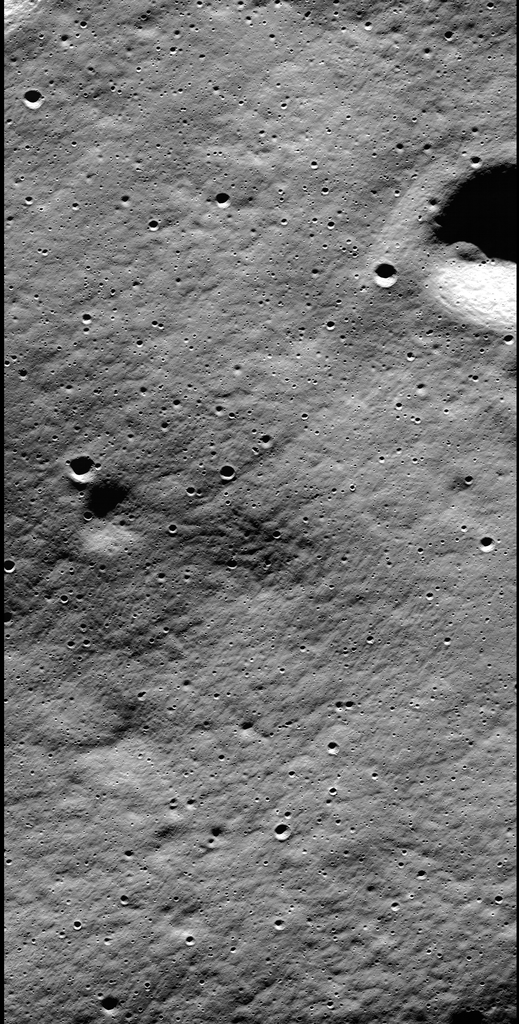
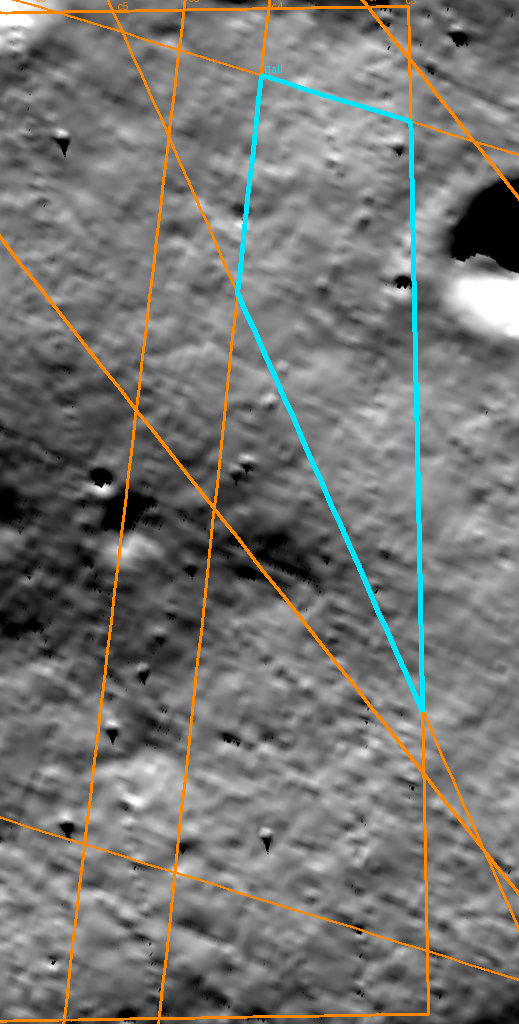
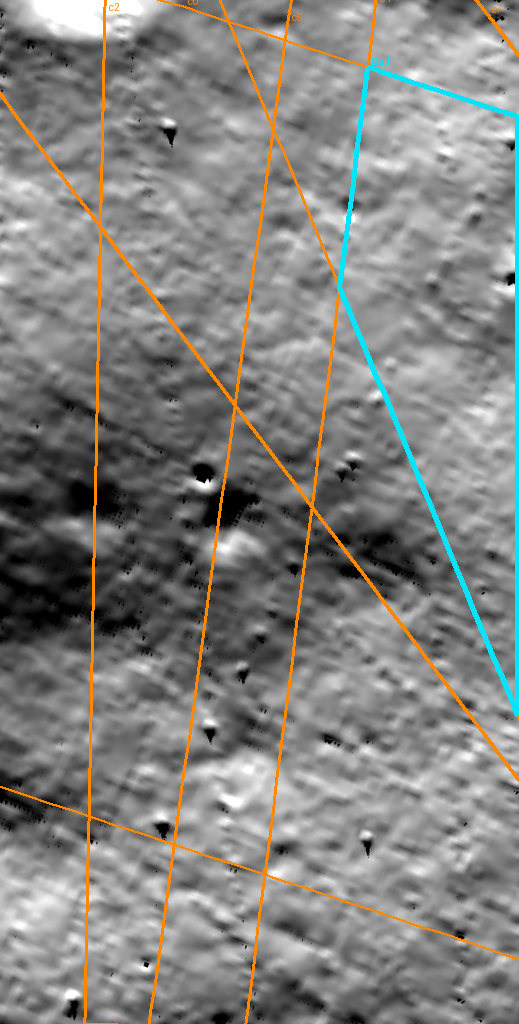
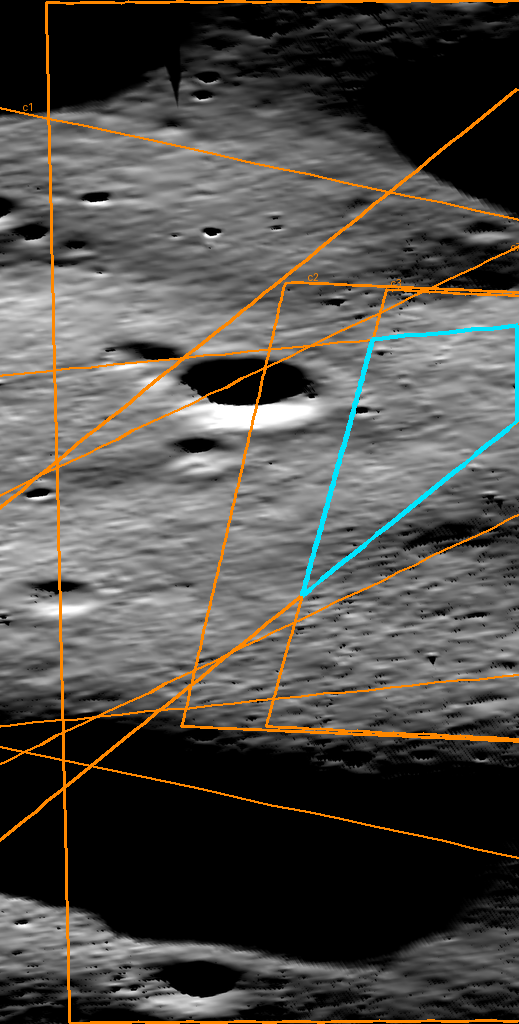
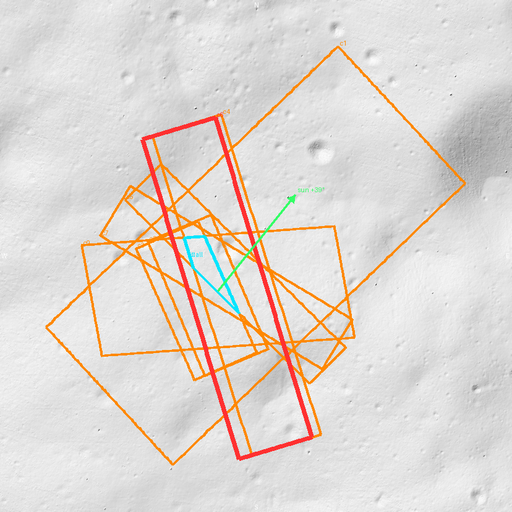
+ NAC footprints, coloured by sun_az evaluated at AOI centre
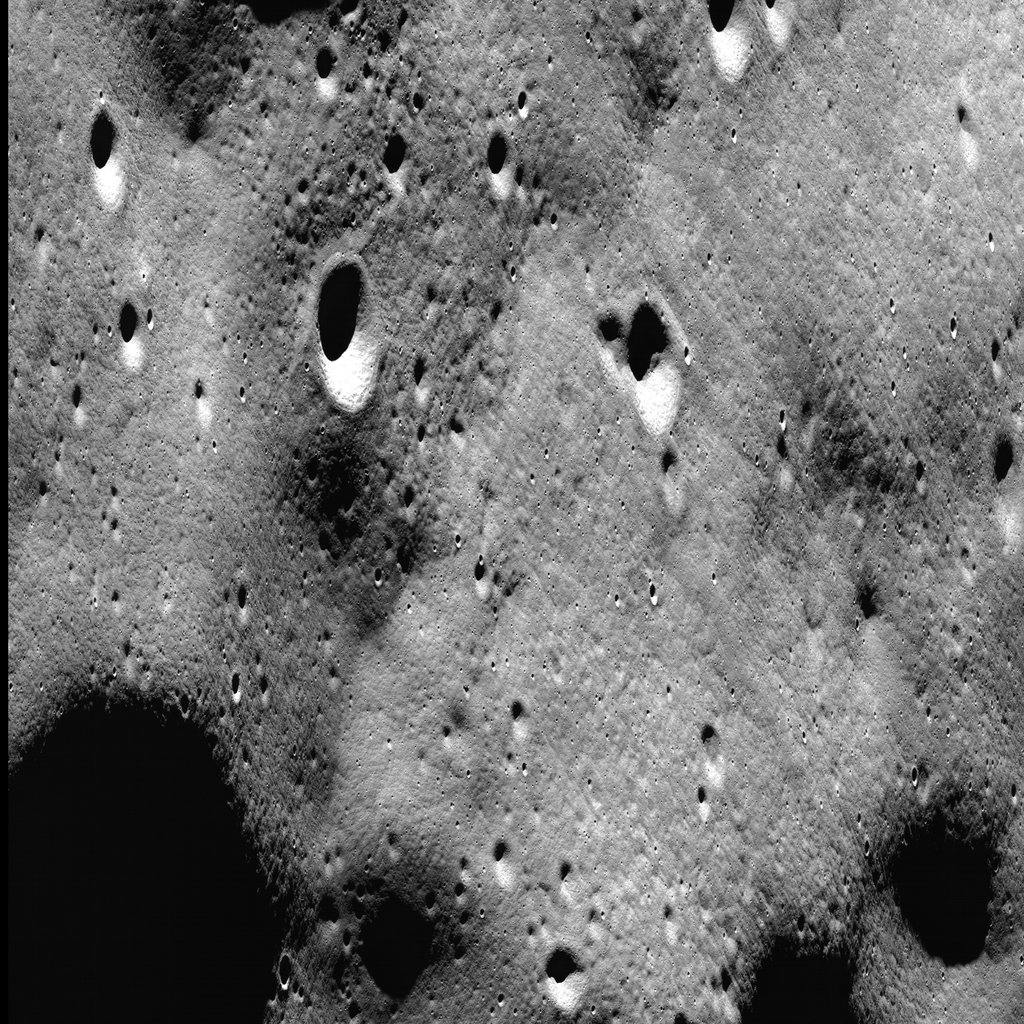
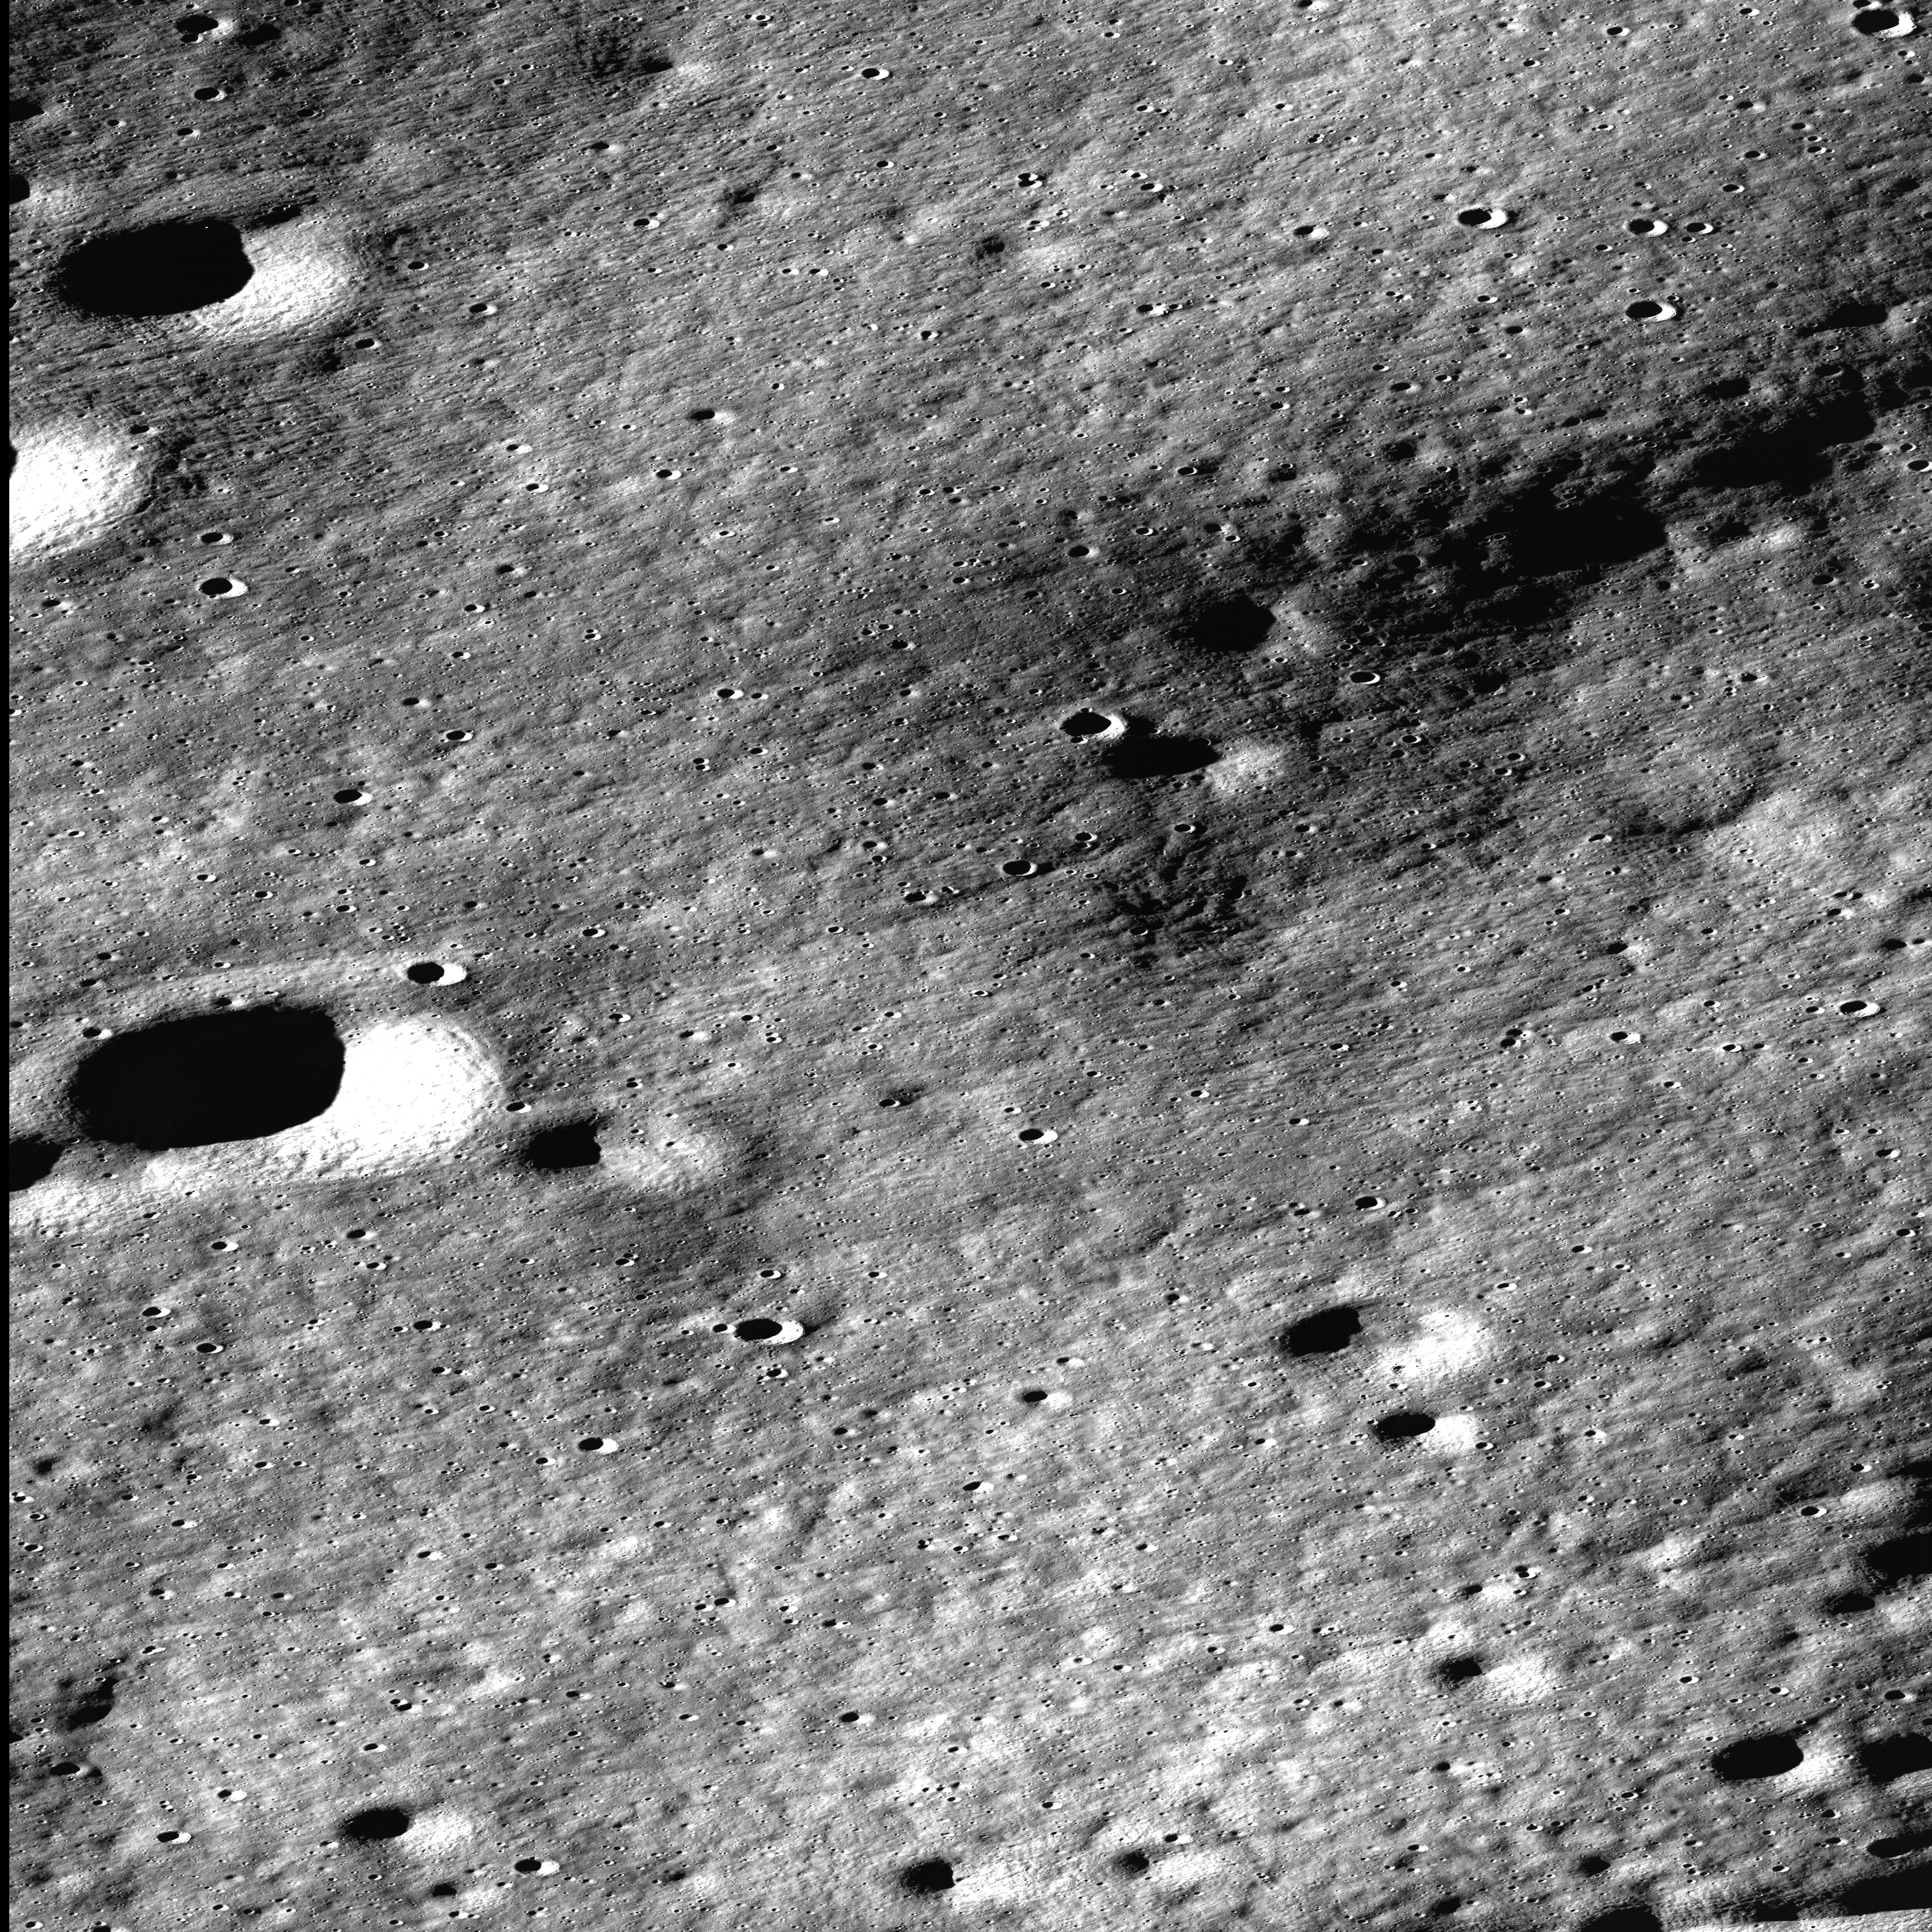
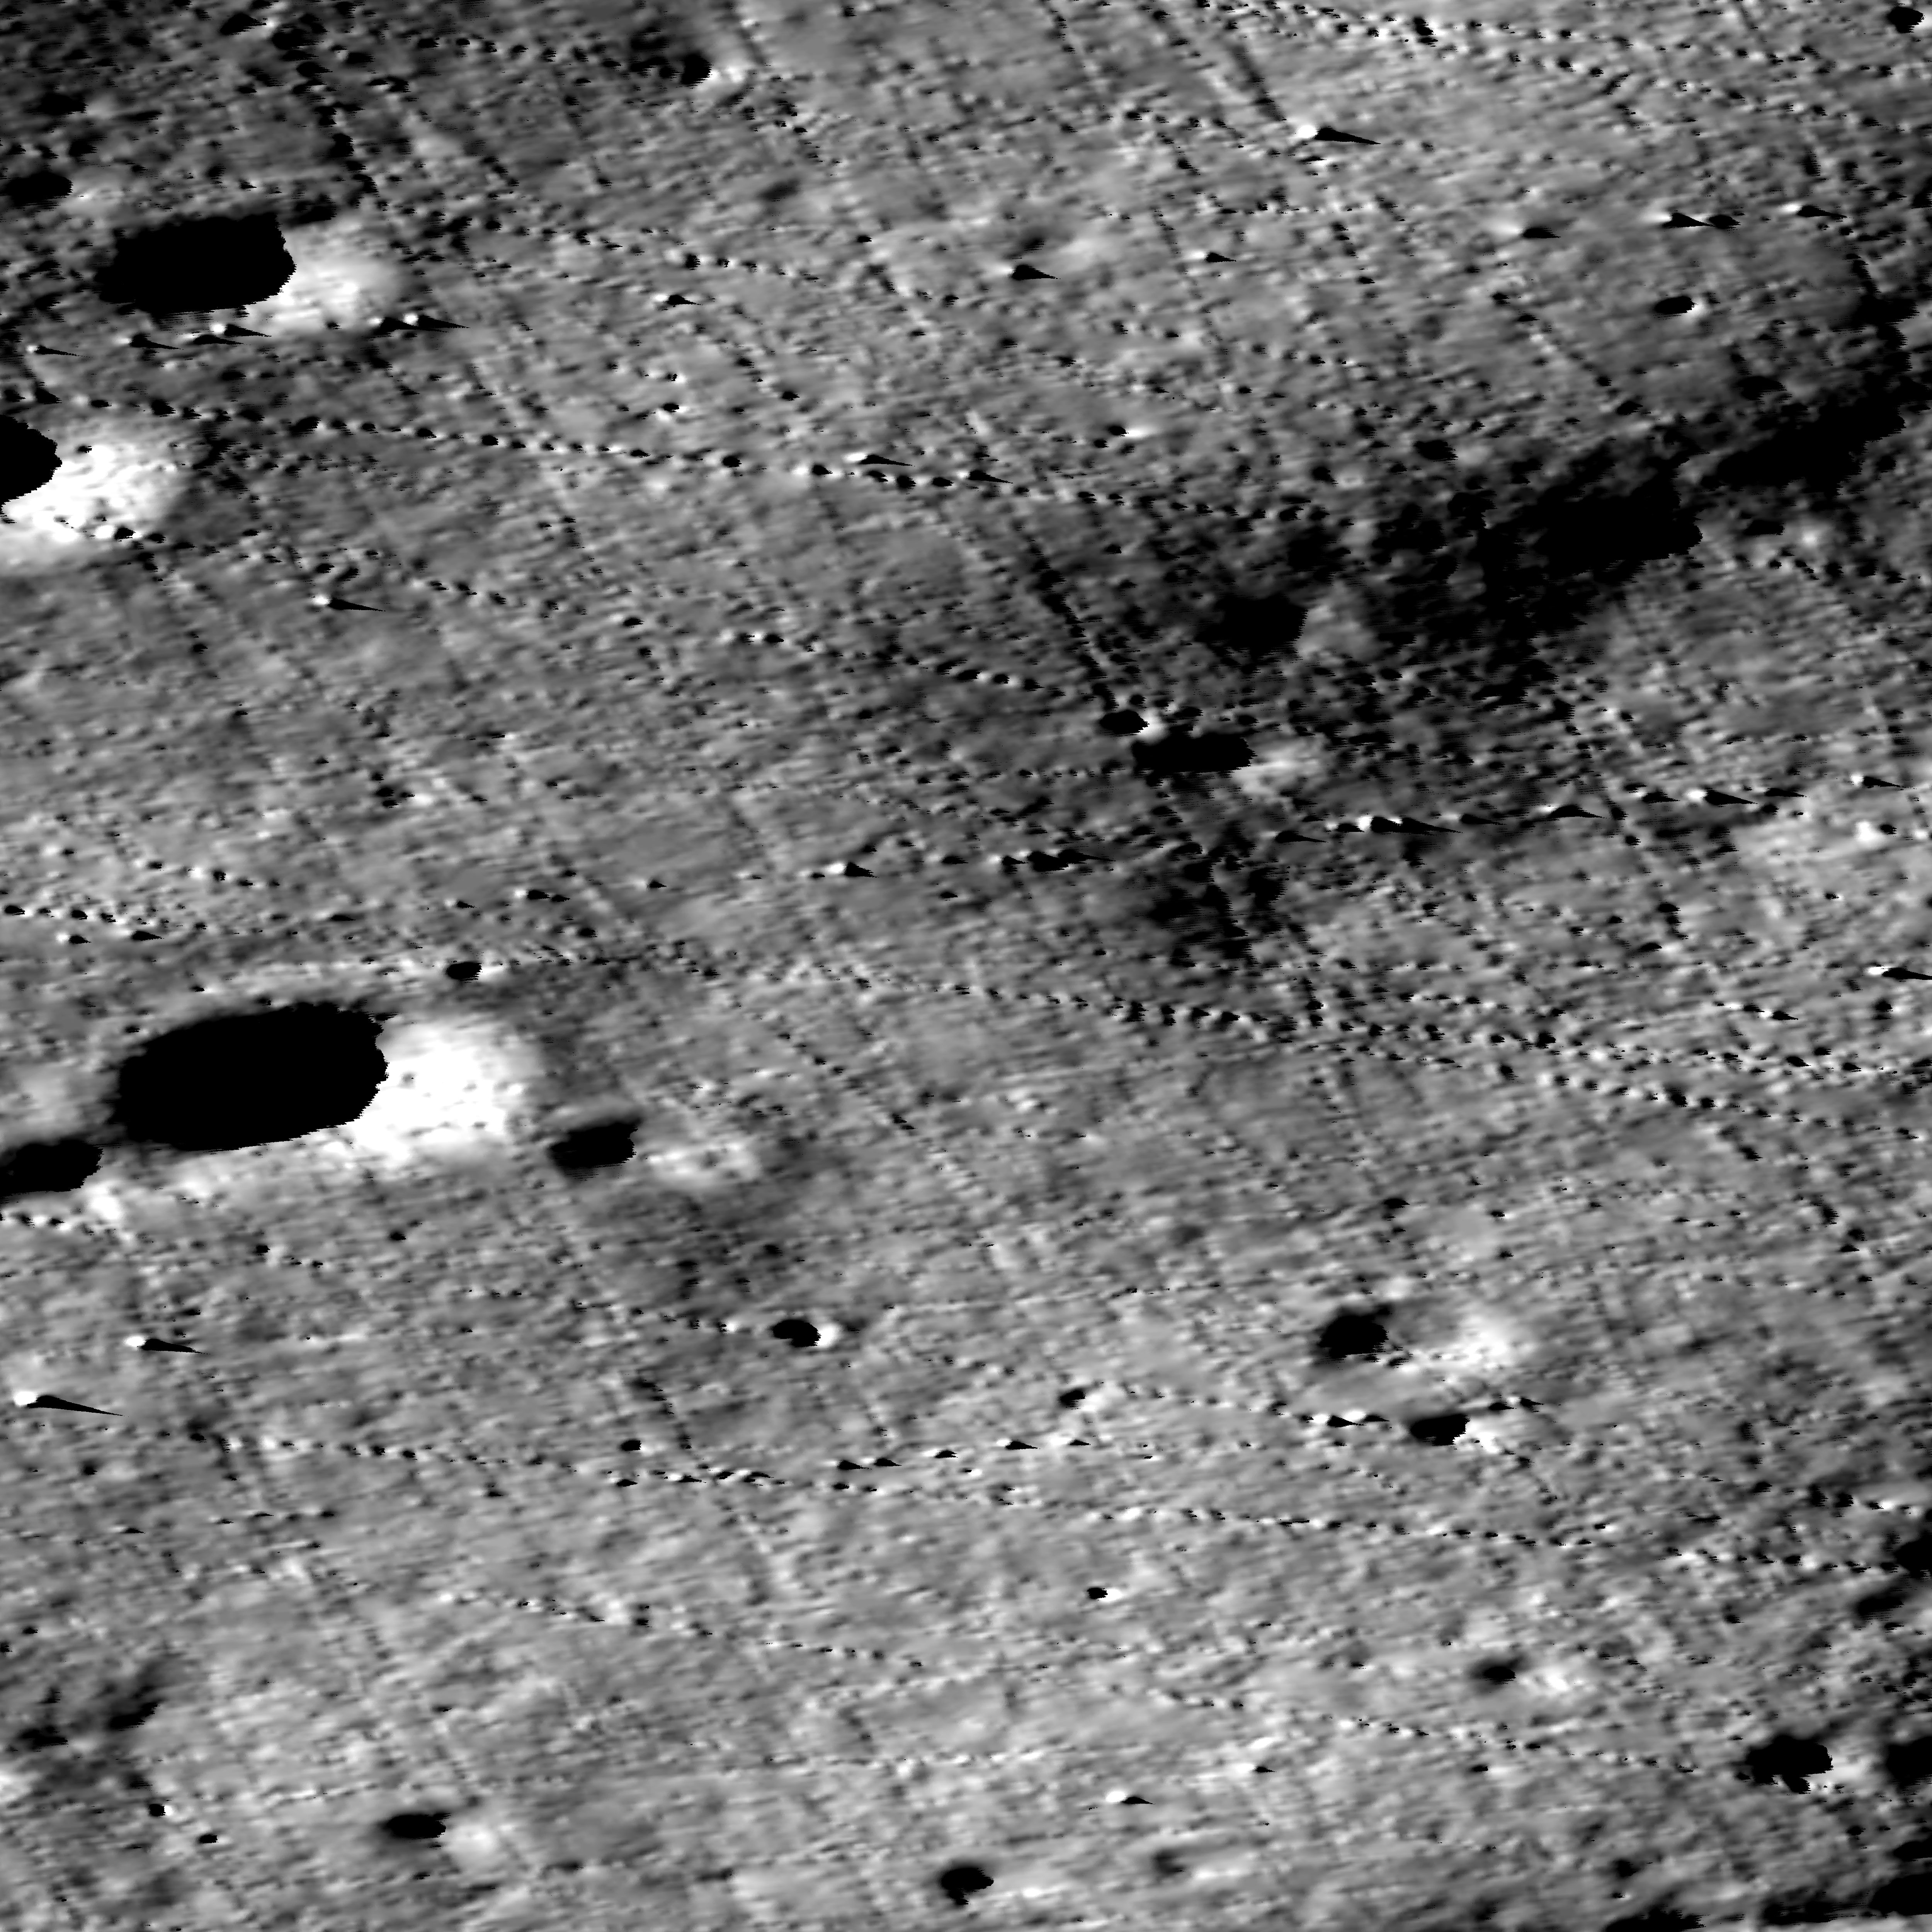
Left: full APENNINE01 truth DEM rendered as shaded relief (NW sun, vert exag 3x), sourced directly from v23_truth_dtms/APENNINE01.npz. AOI is ~13941 x 3460 cells at 5 m posting (~1200 km², 17 km wide strip from lat 24.0 - 26.3°N). Apennine highlands mountainous terrain visible in the upper half, smoother mare-like terrain at the base. Right: same shaded relief with each of the 52 v23 NAC footprints traced by row-by-row left/right valid-pixel scan of the cam2map'd TIF. Outline colour encodes sun azimuth (twilight cyclic colormap, N up, E right) -- orange/yellow strips are morning ESE-sun NACs (~110°), purple/blue strips are afternoon WSW-sun NACs (~250°). Strips are narrow (typical NAC ~5 km wide) and cover overlapping vertical bands of the AOI; thicker cumulative coverage in the middle of the strip. Driver: drivers/smoke/v23_apennine01_aoi_chart.py.
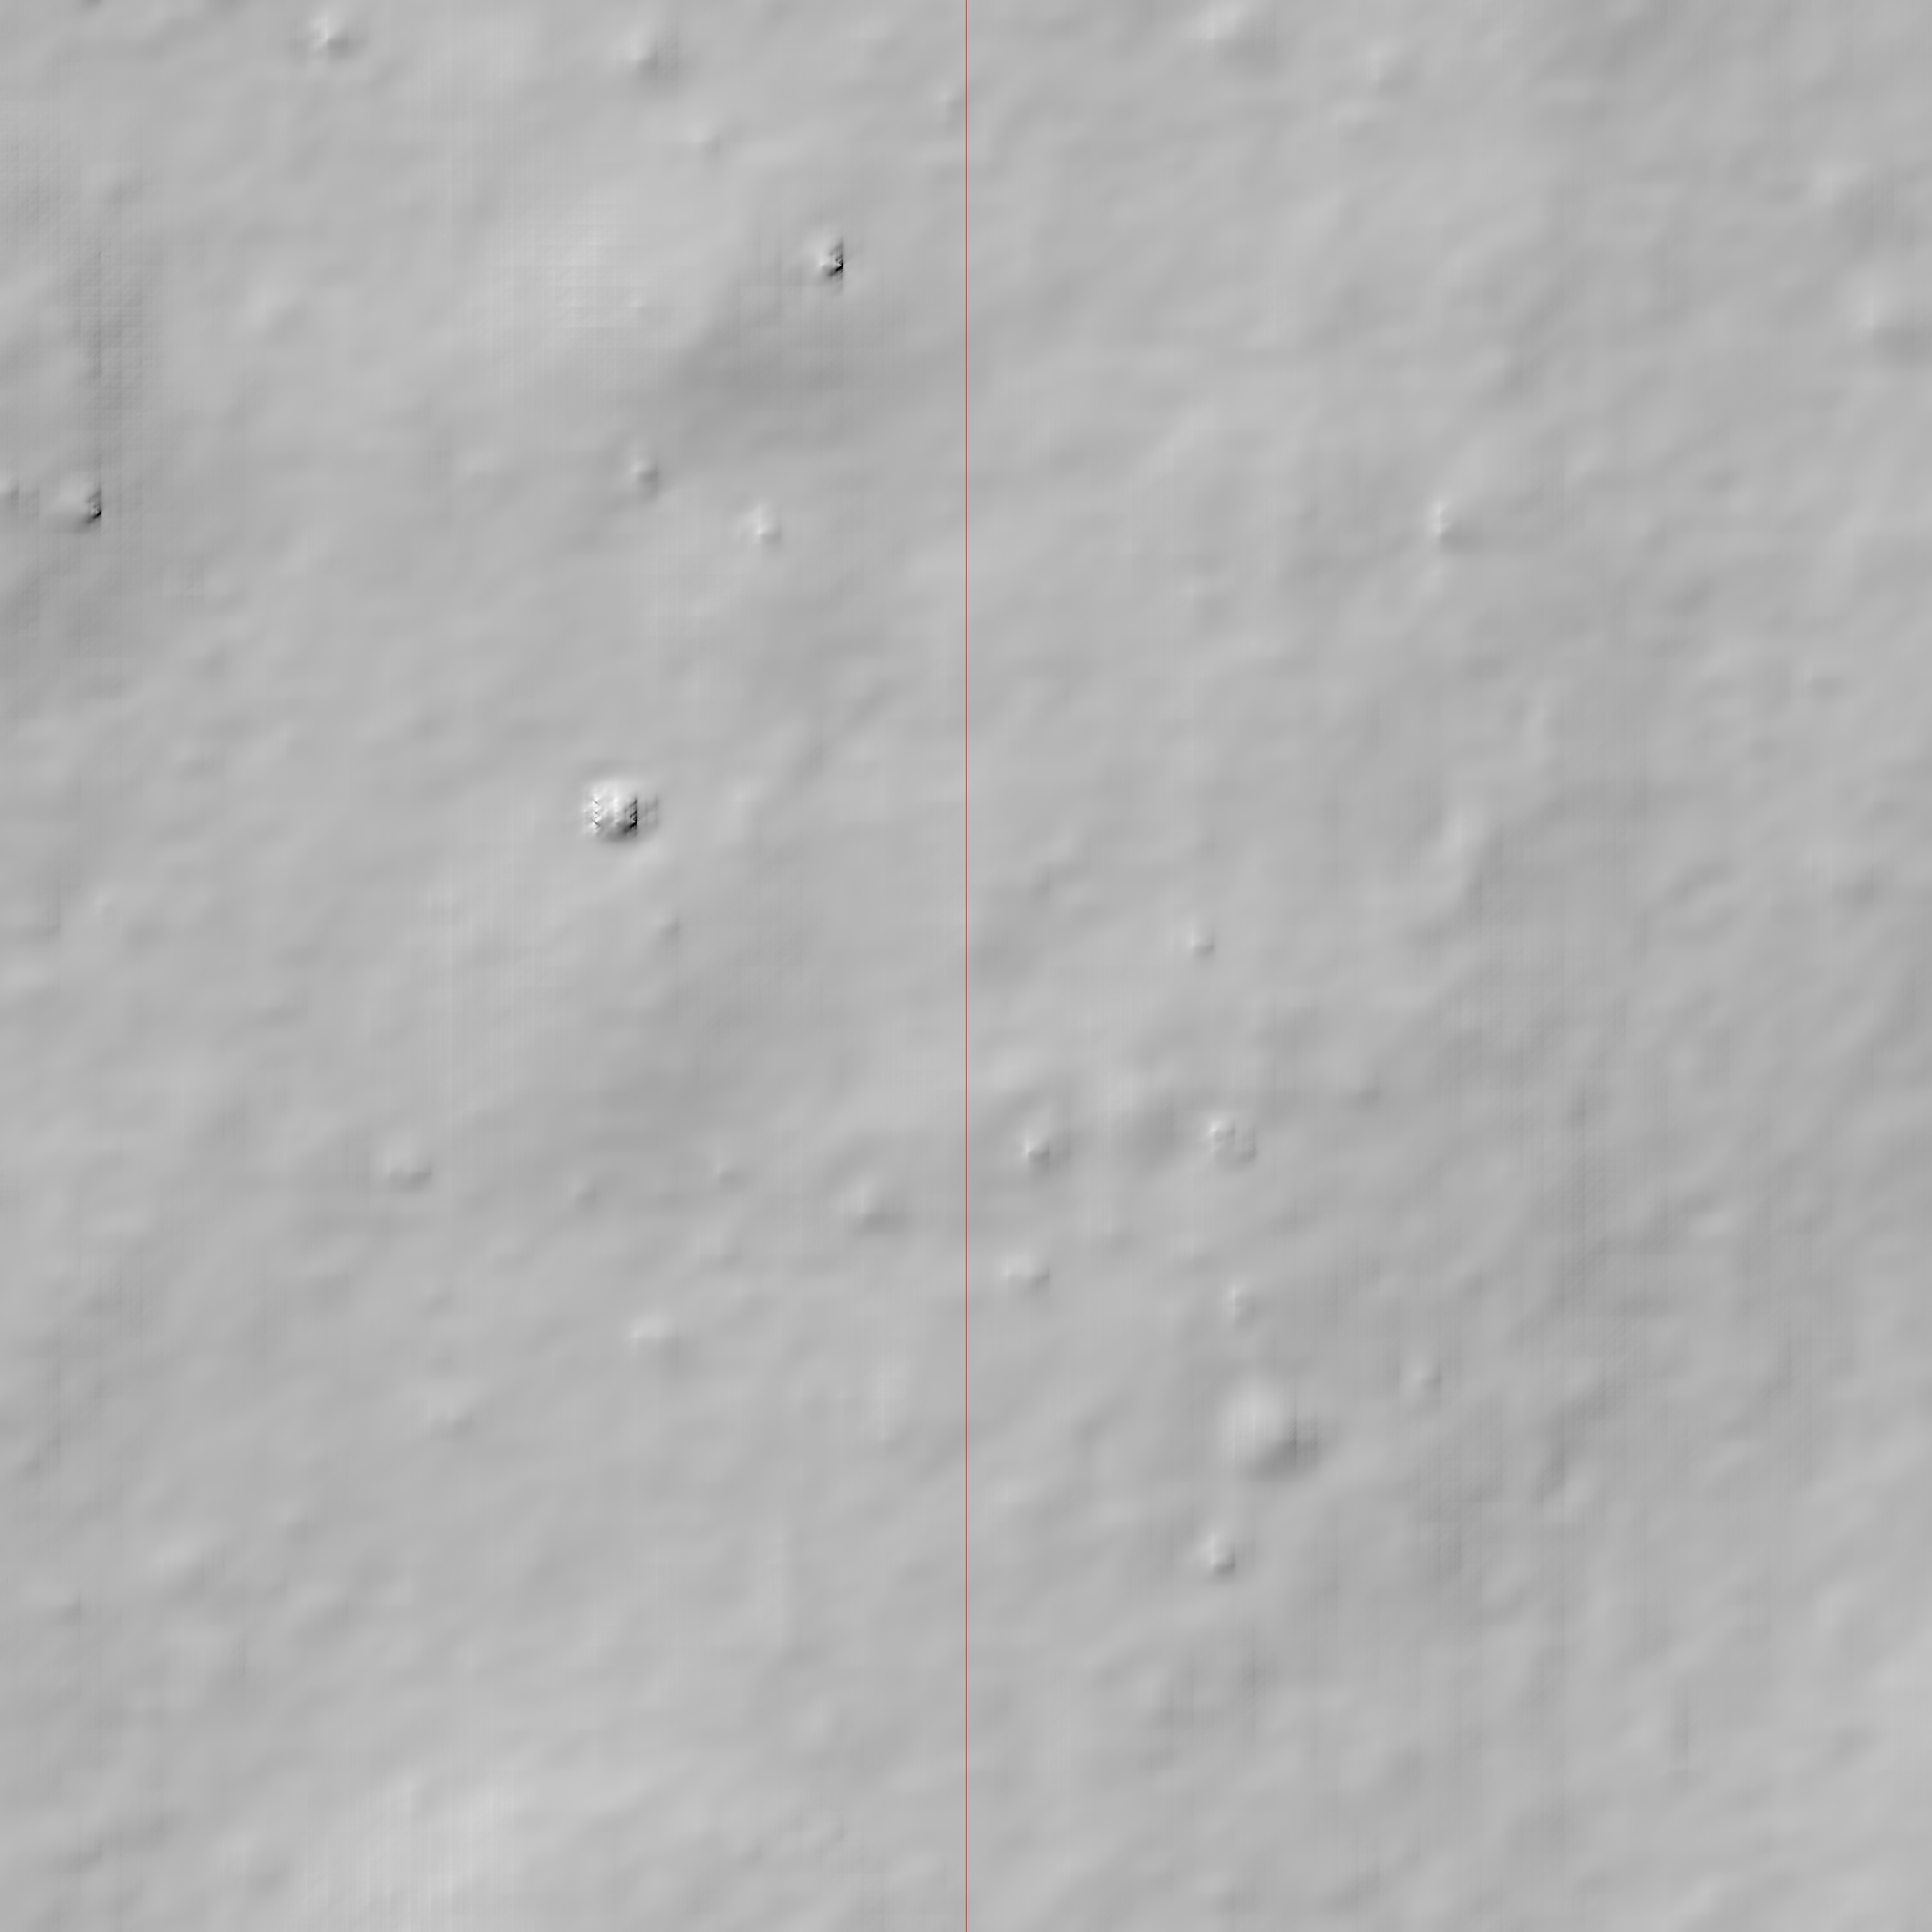
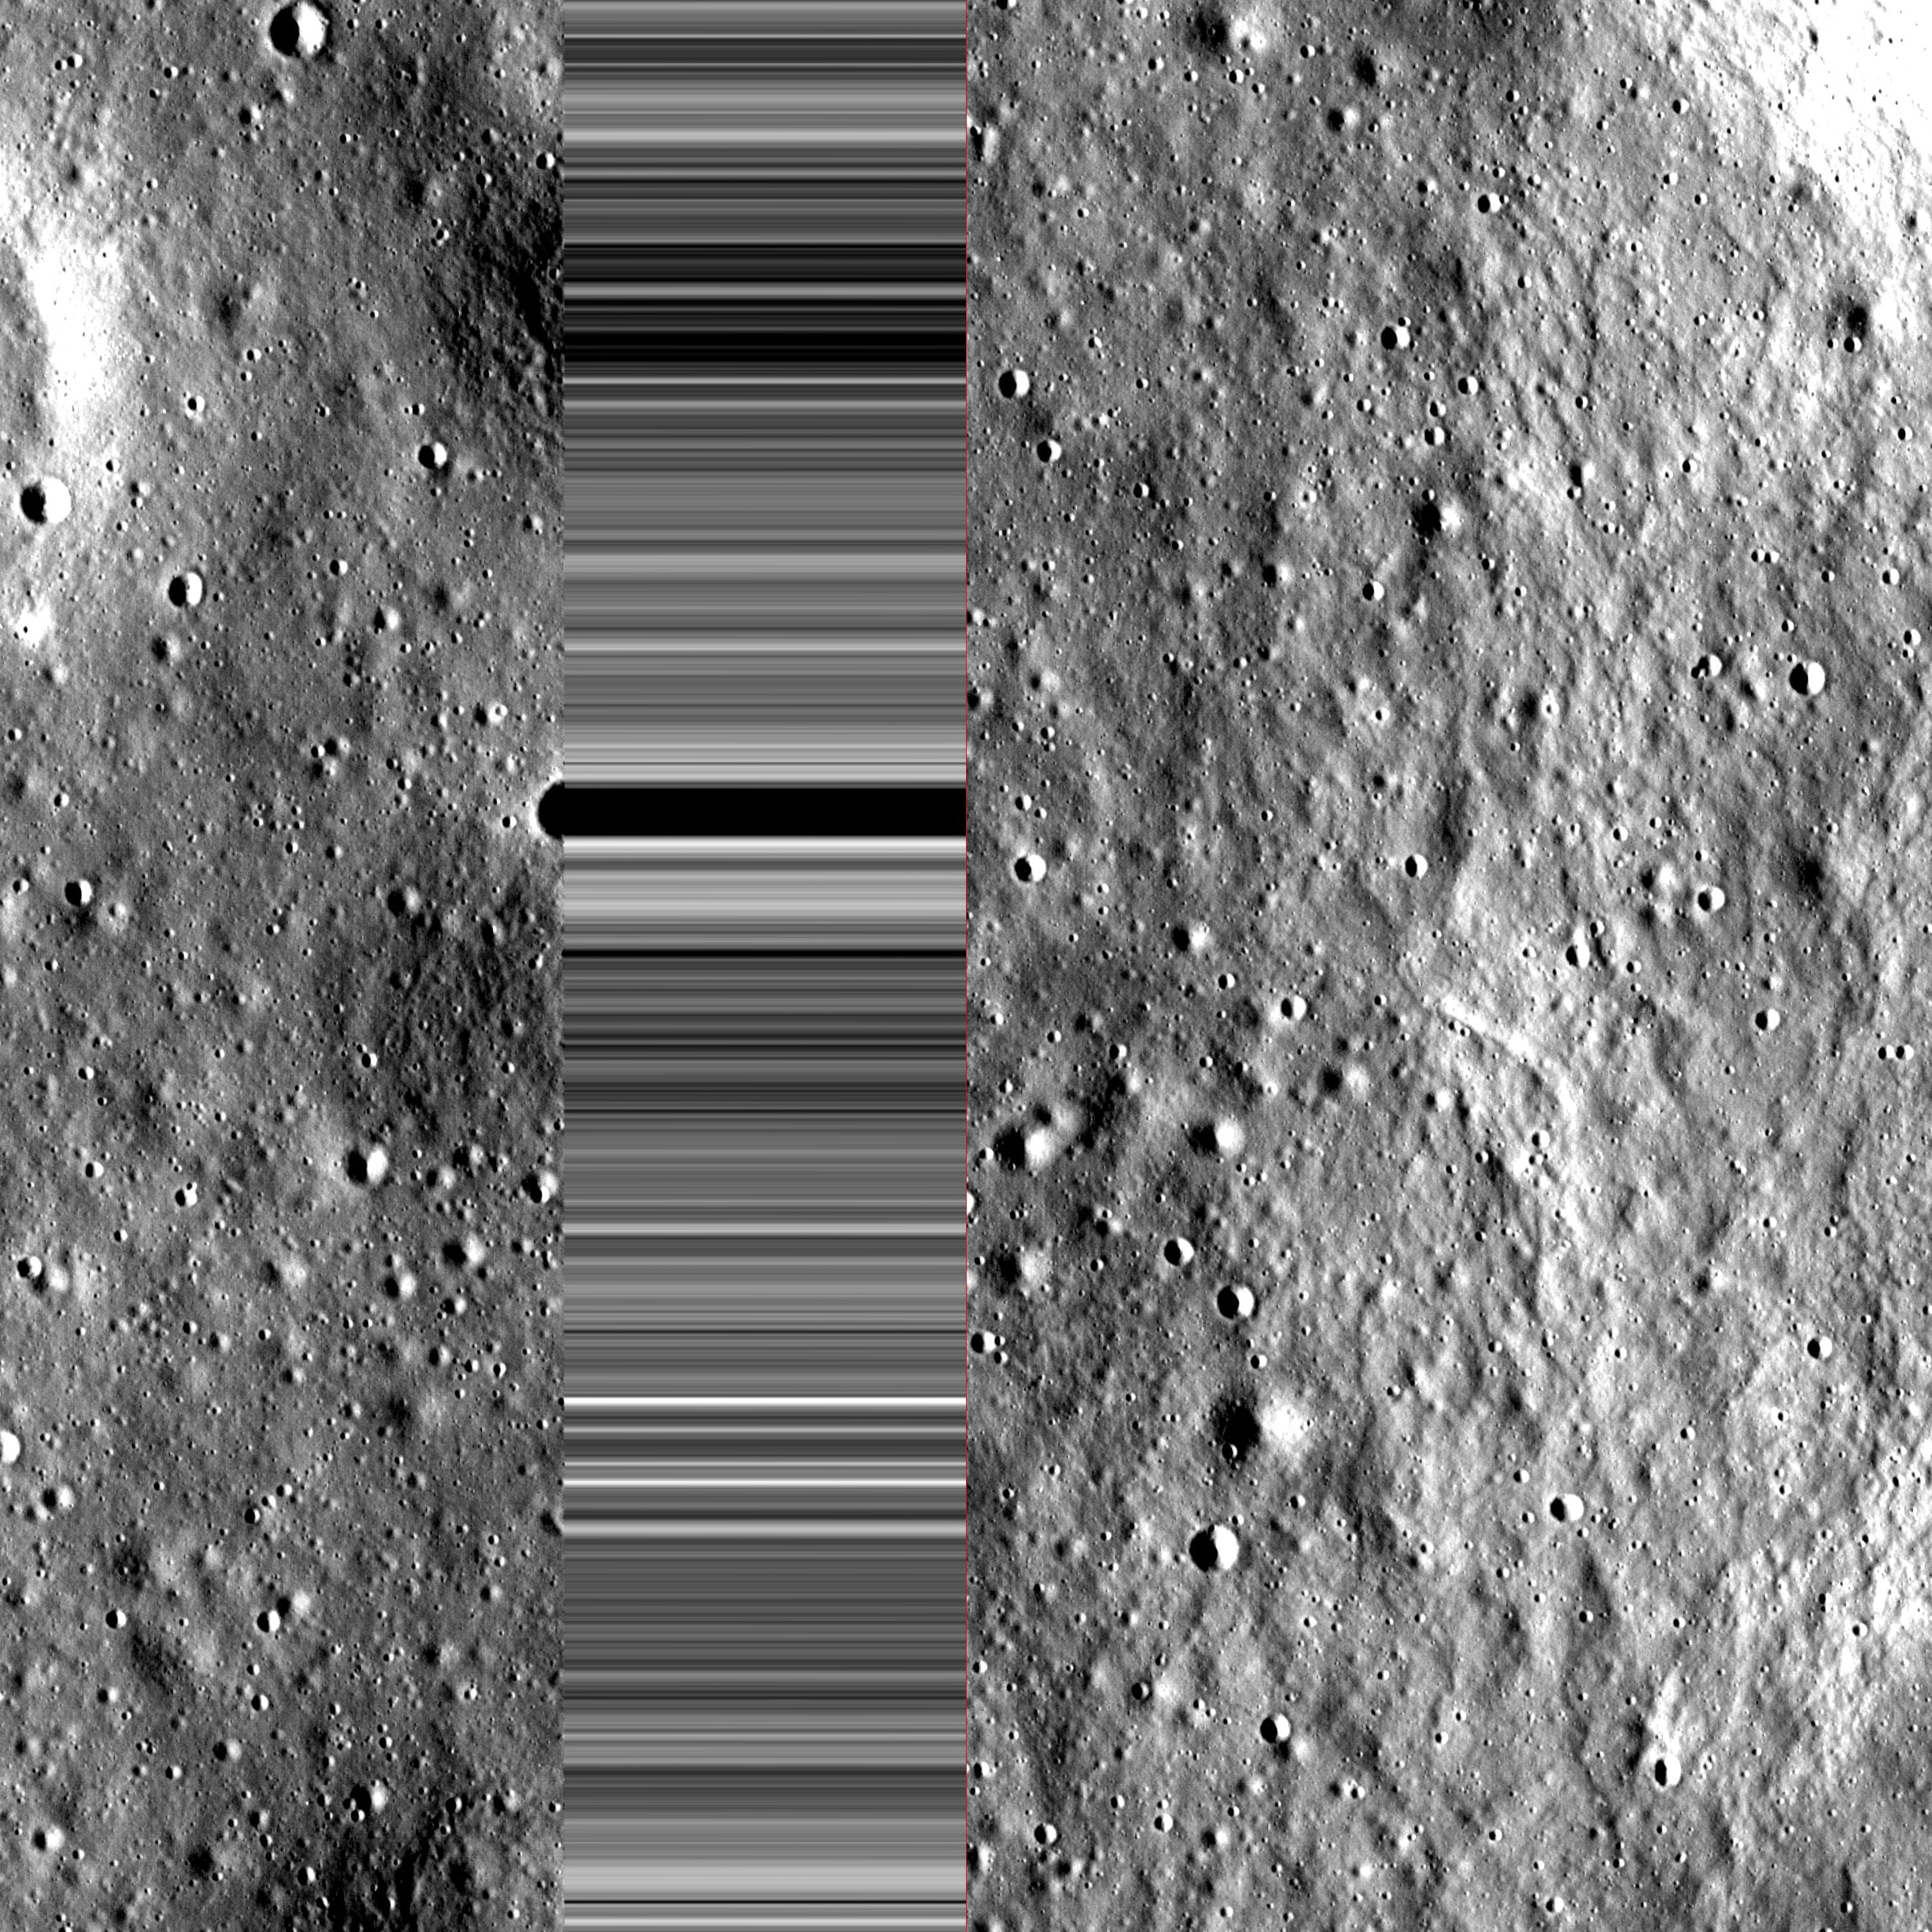
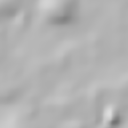
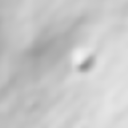
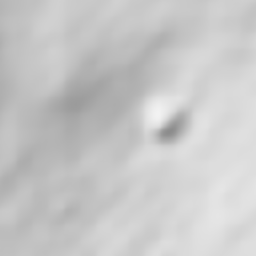
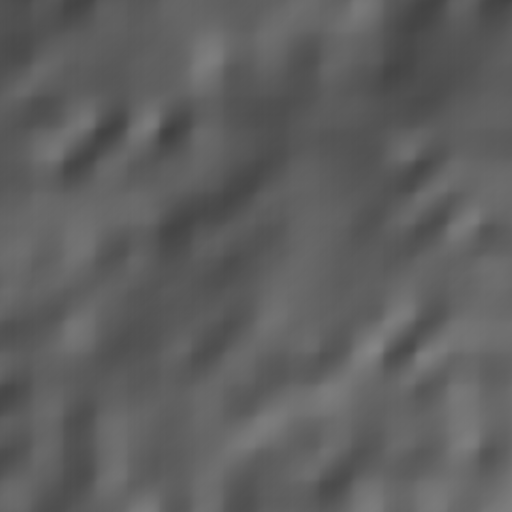
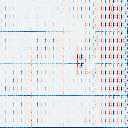
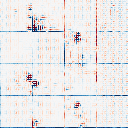
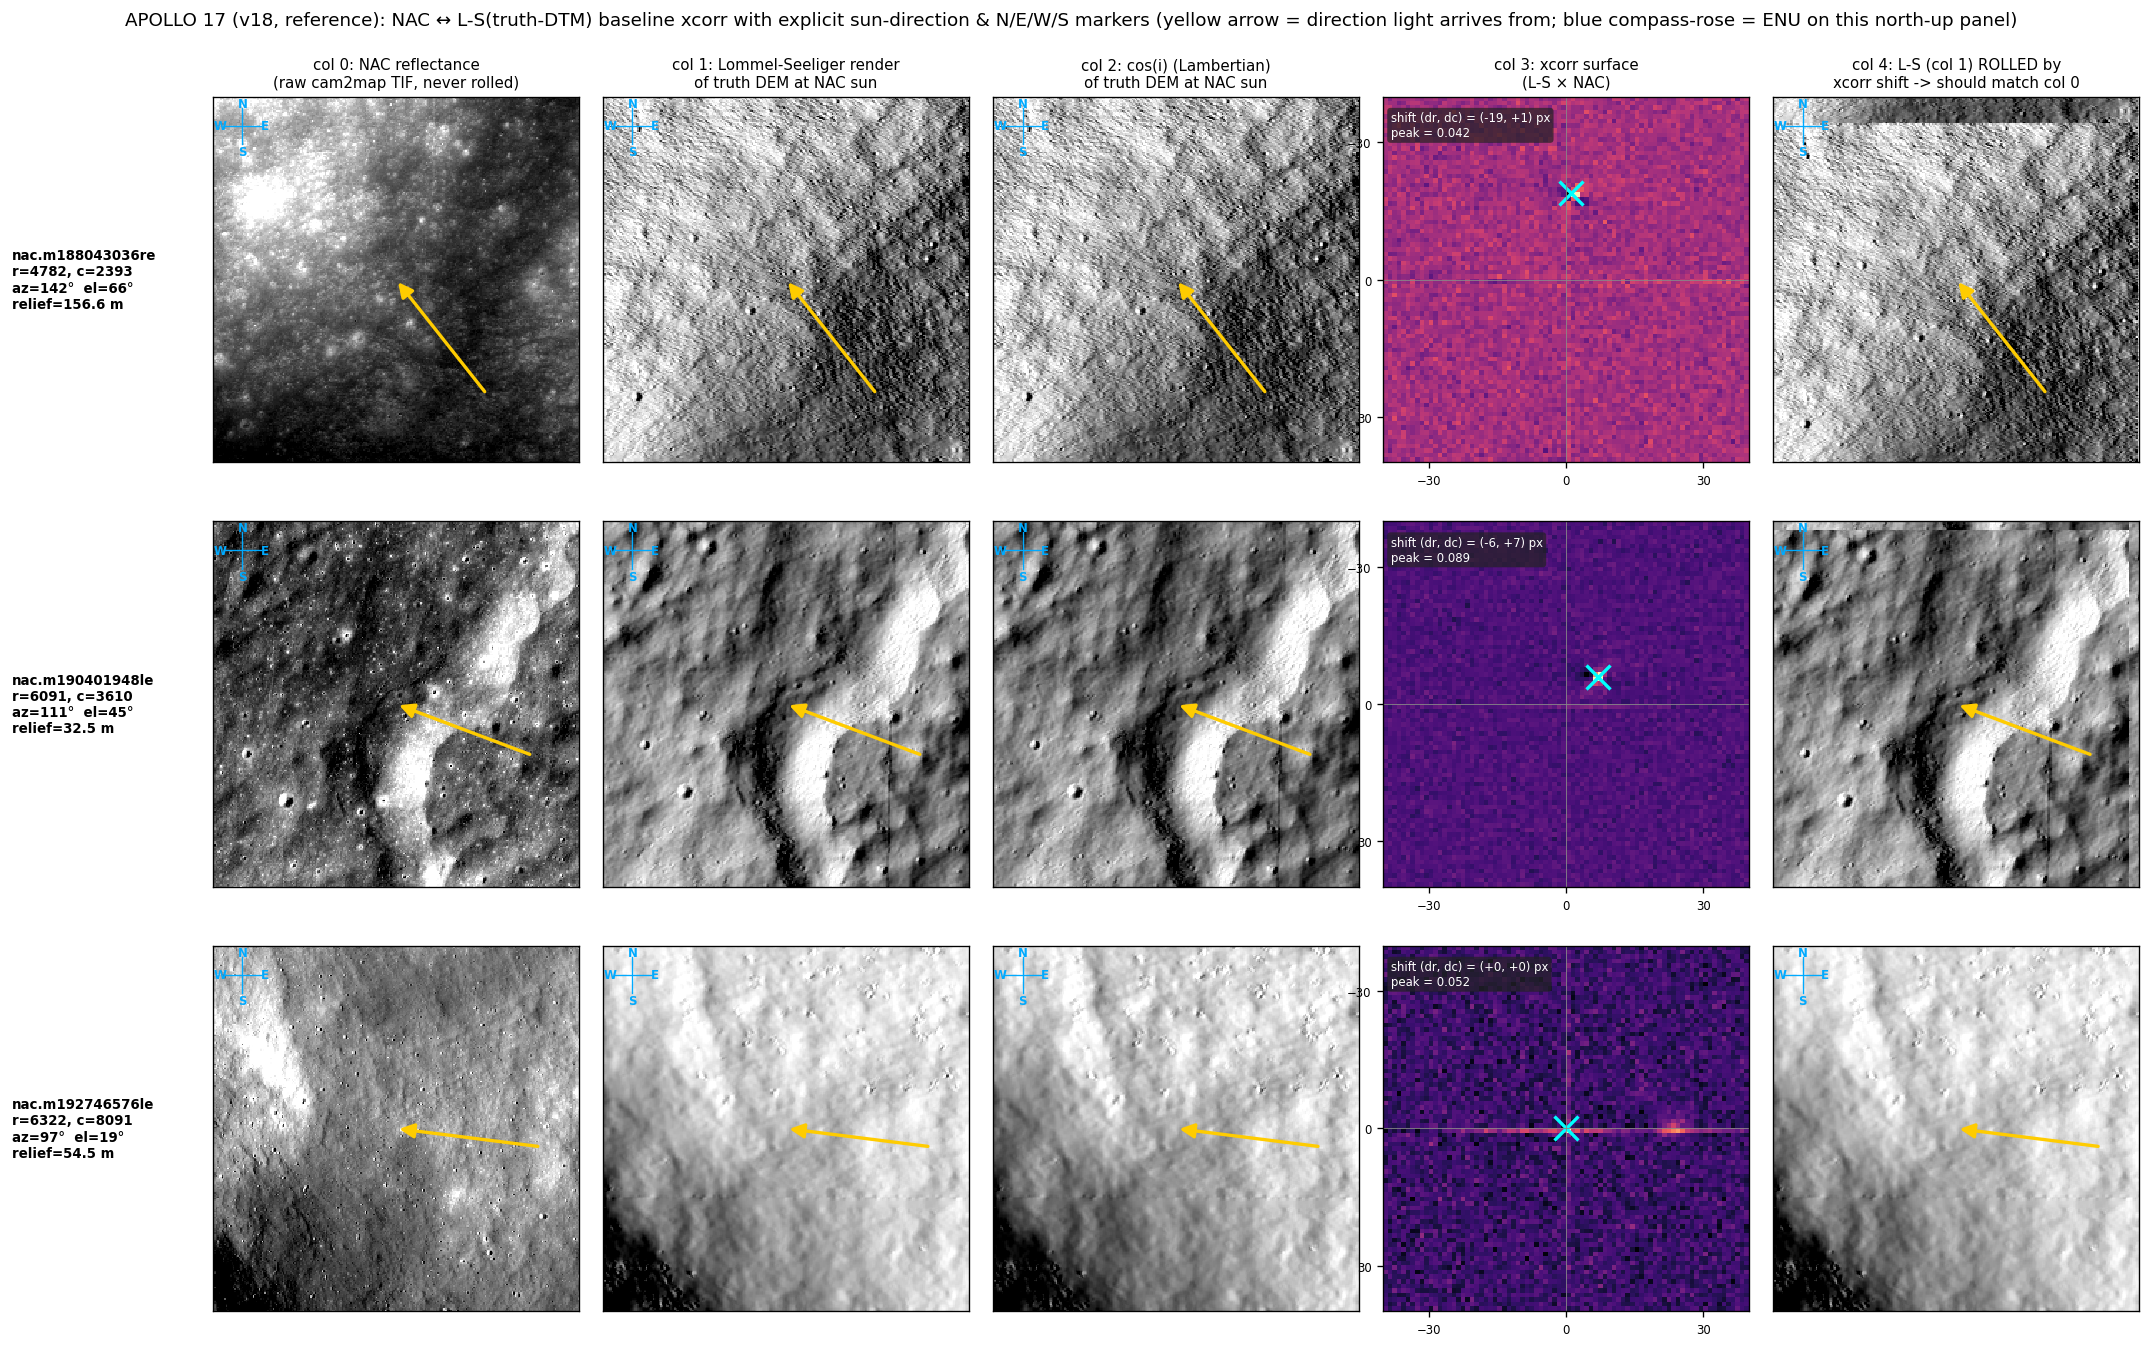
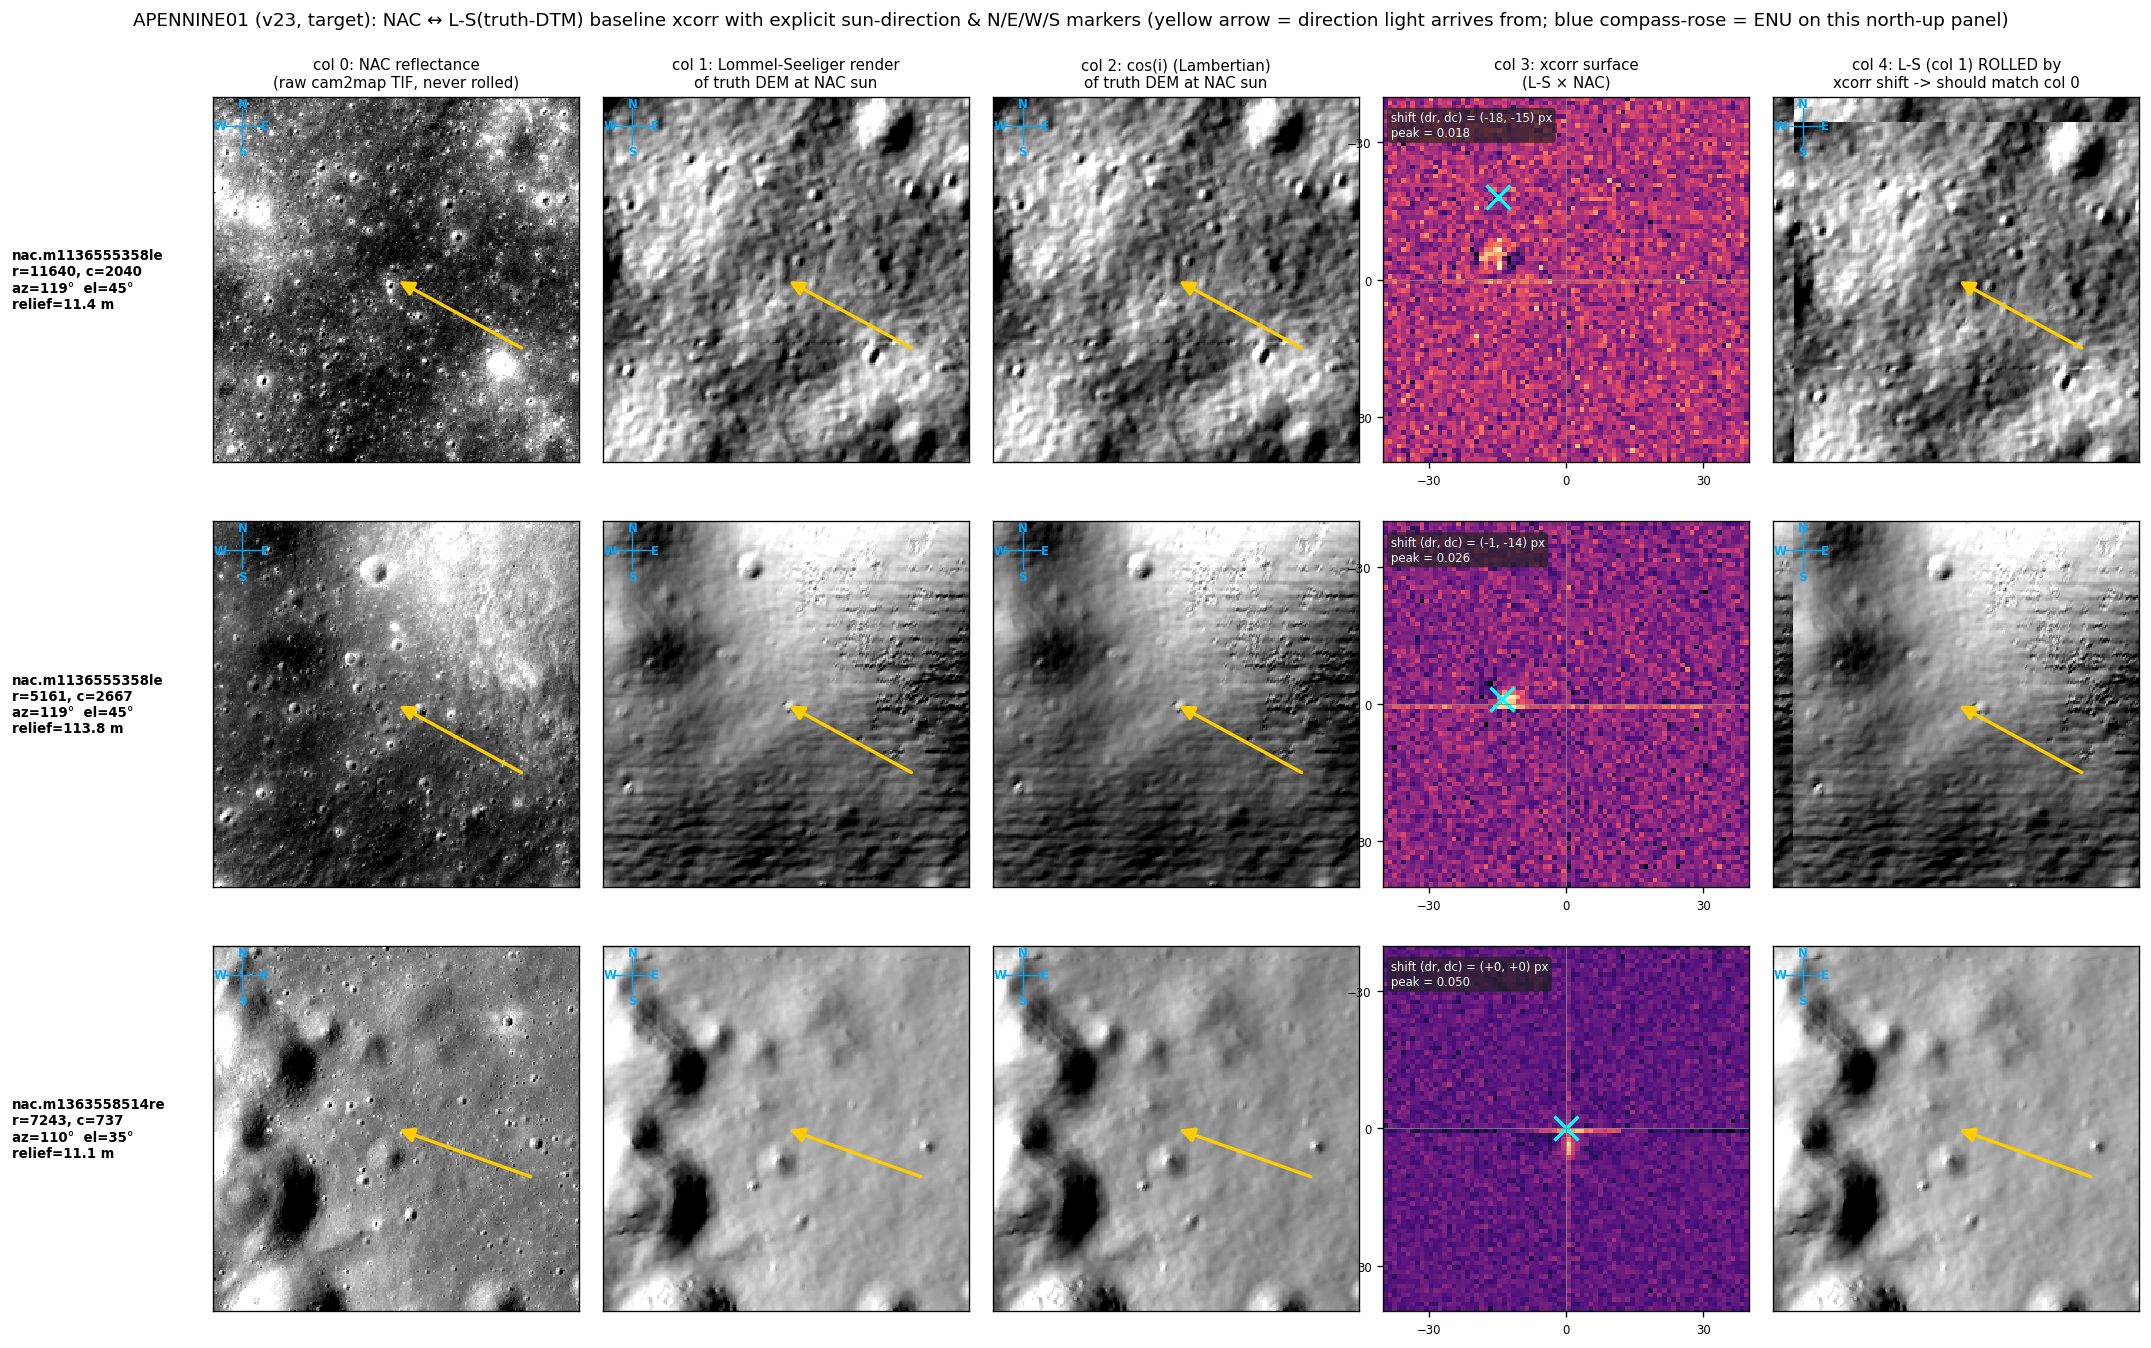
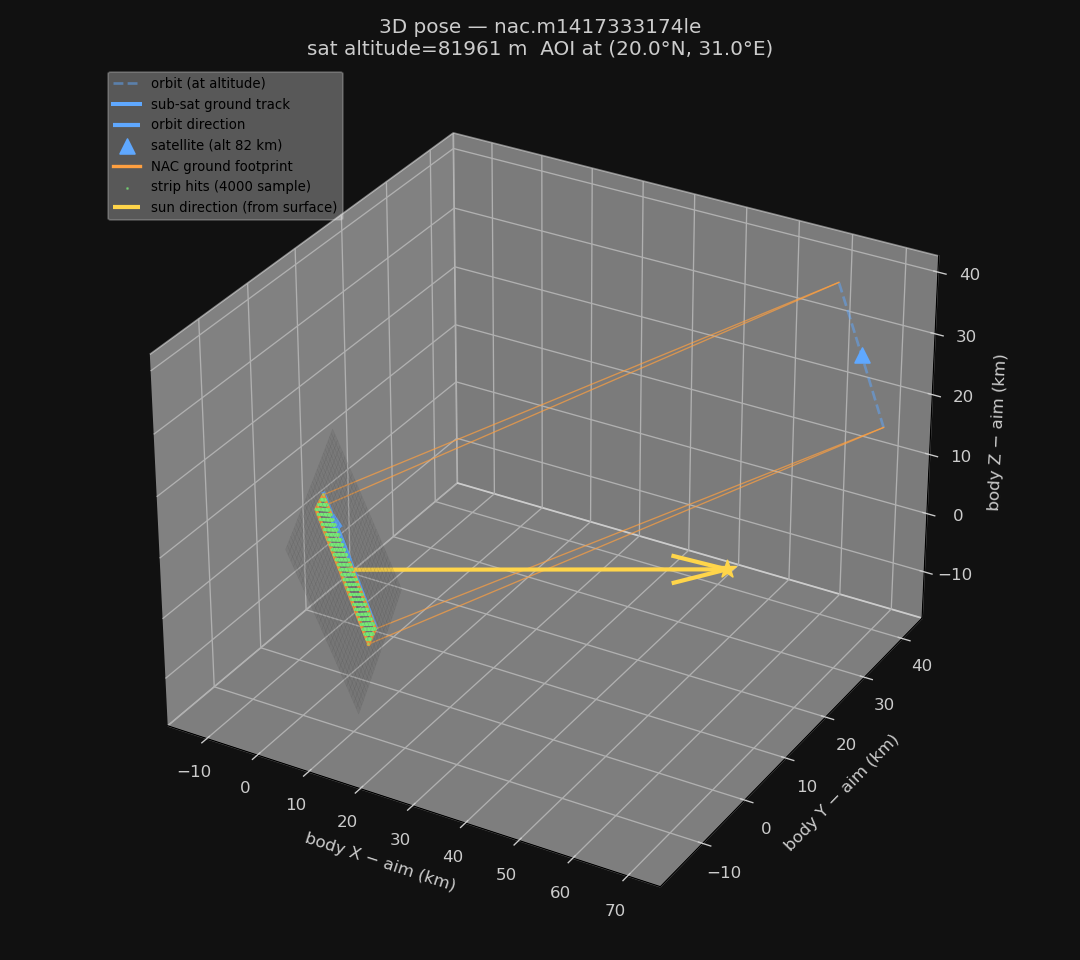
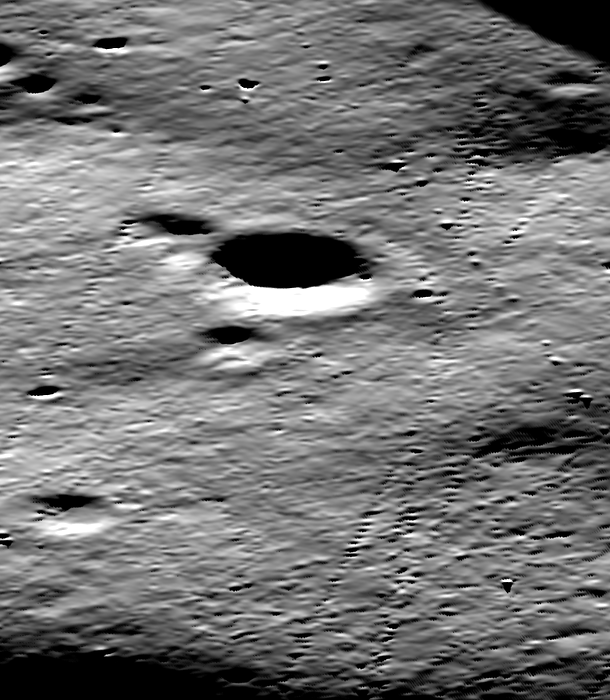
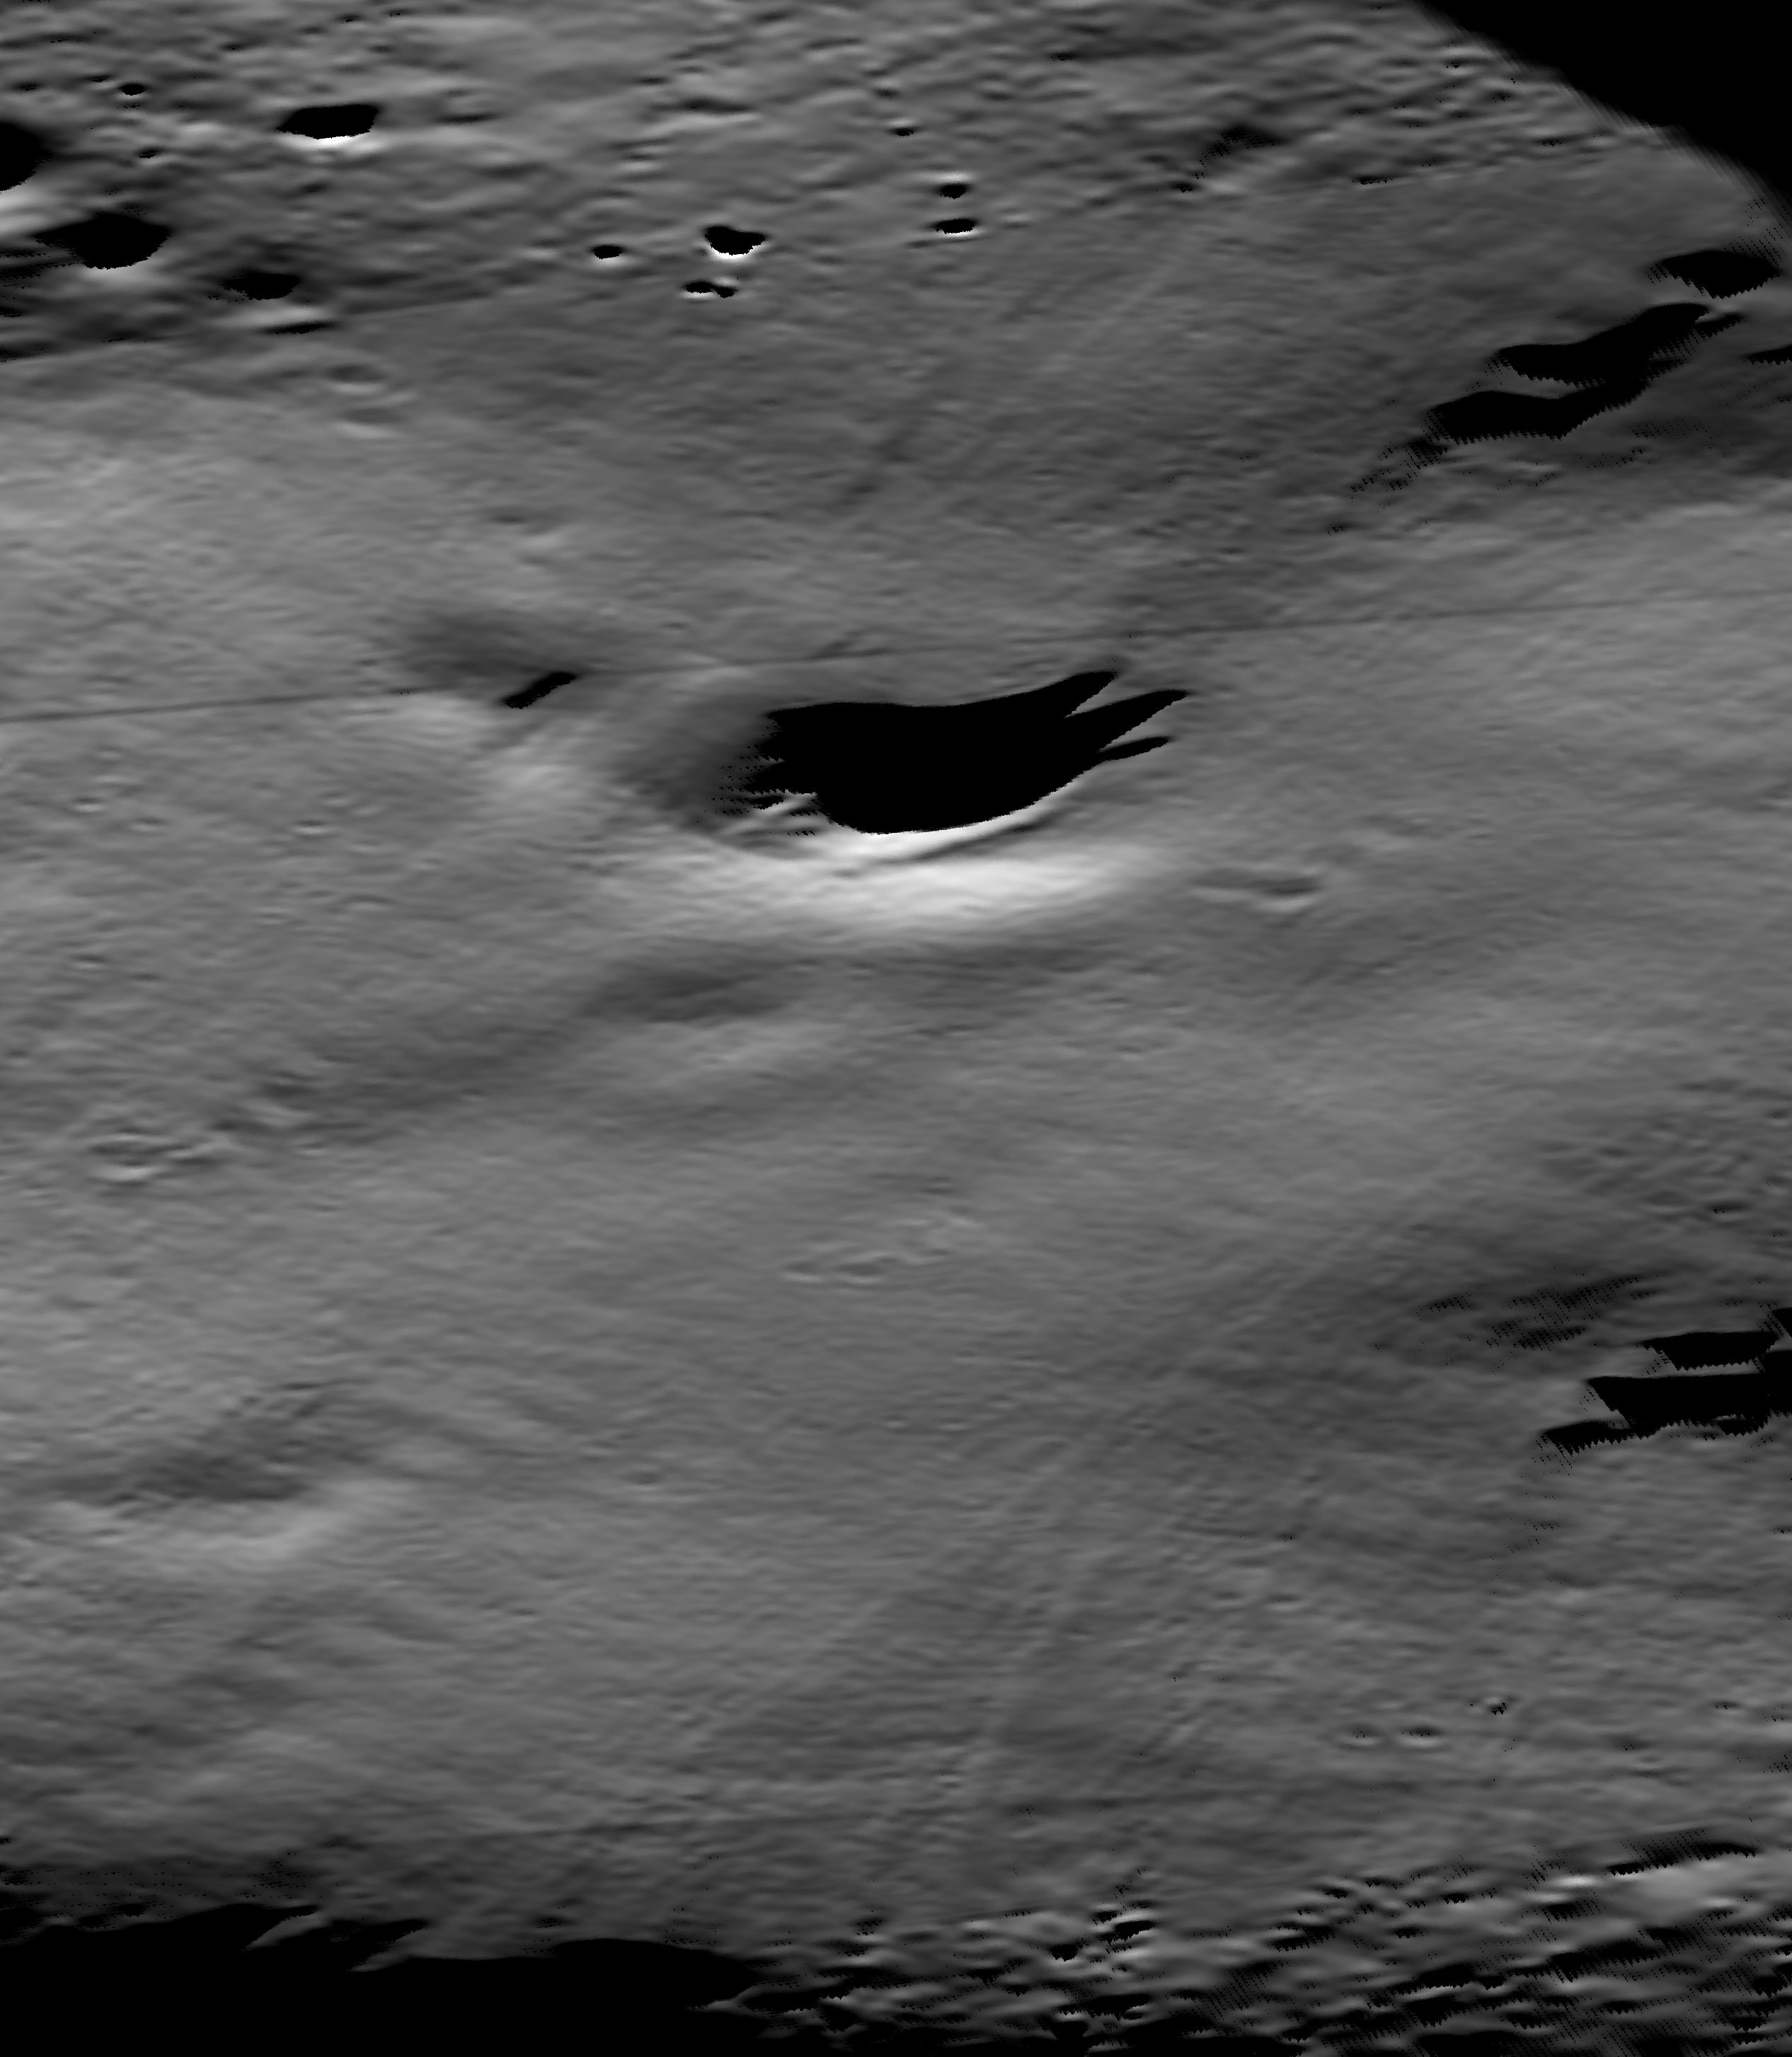
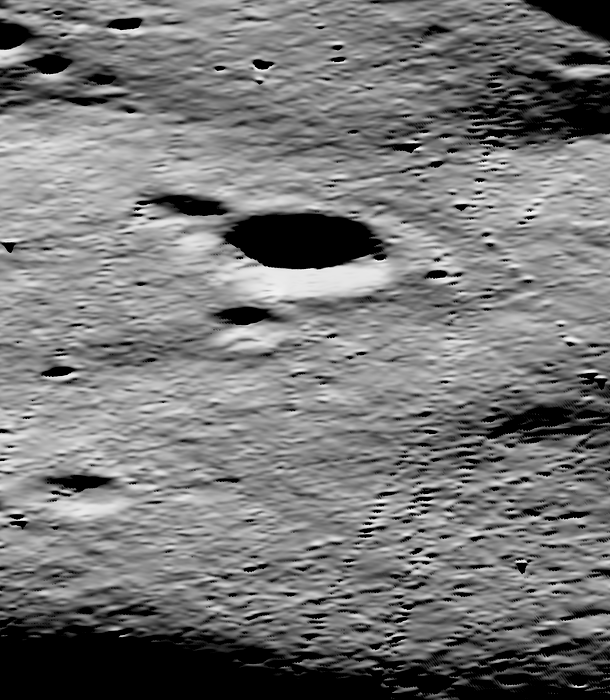
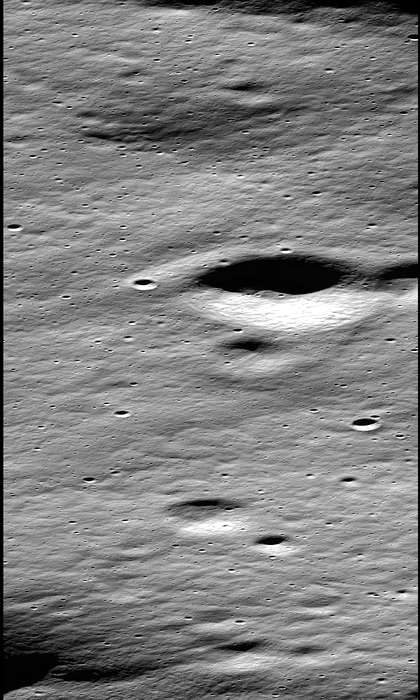
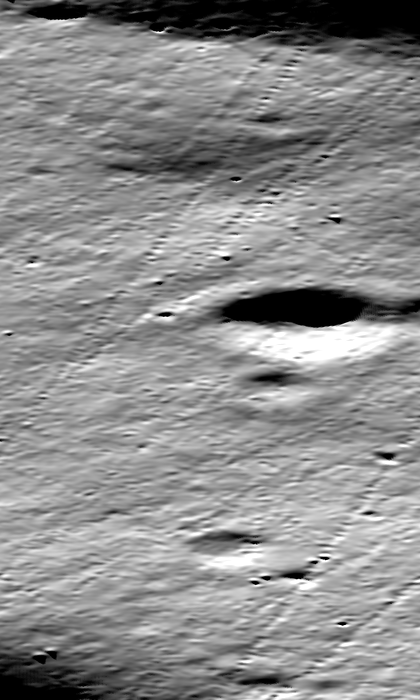
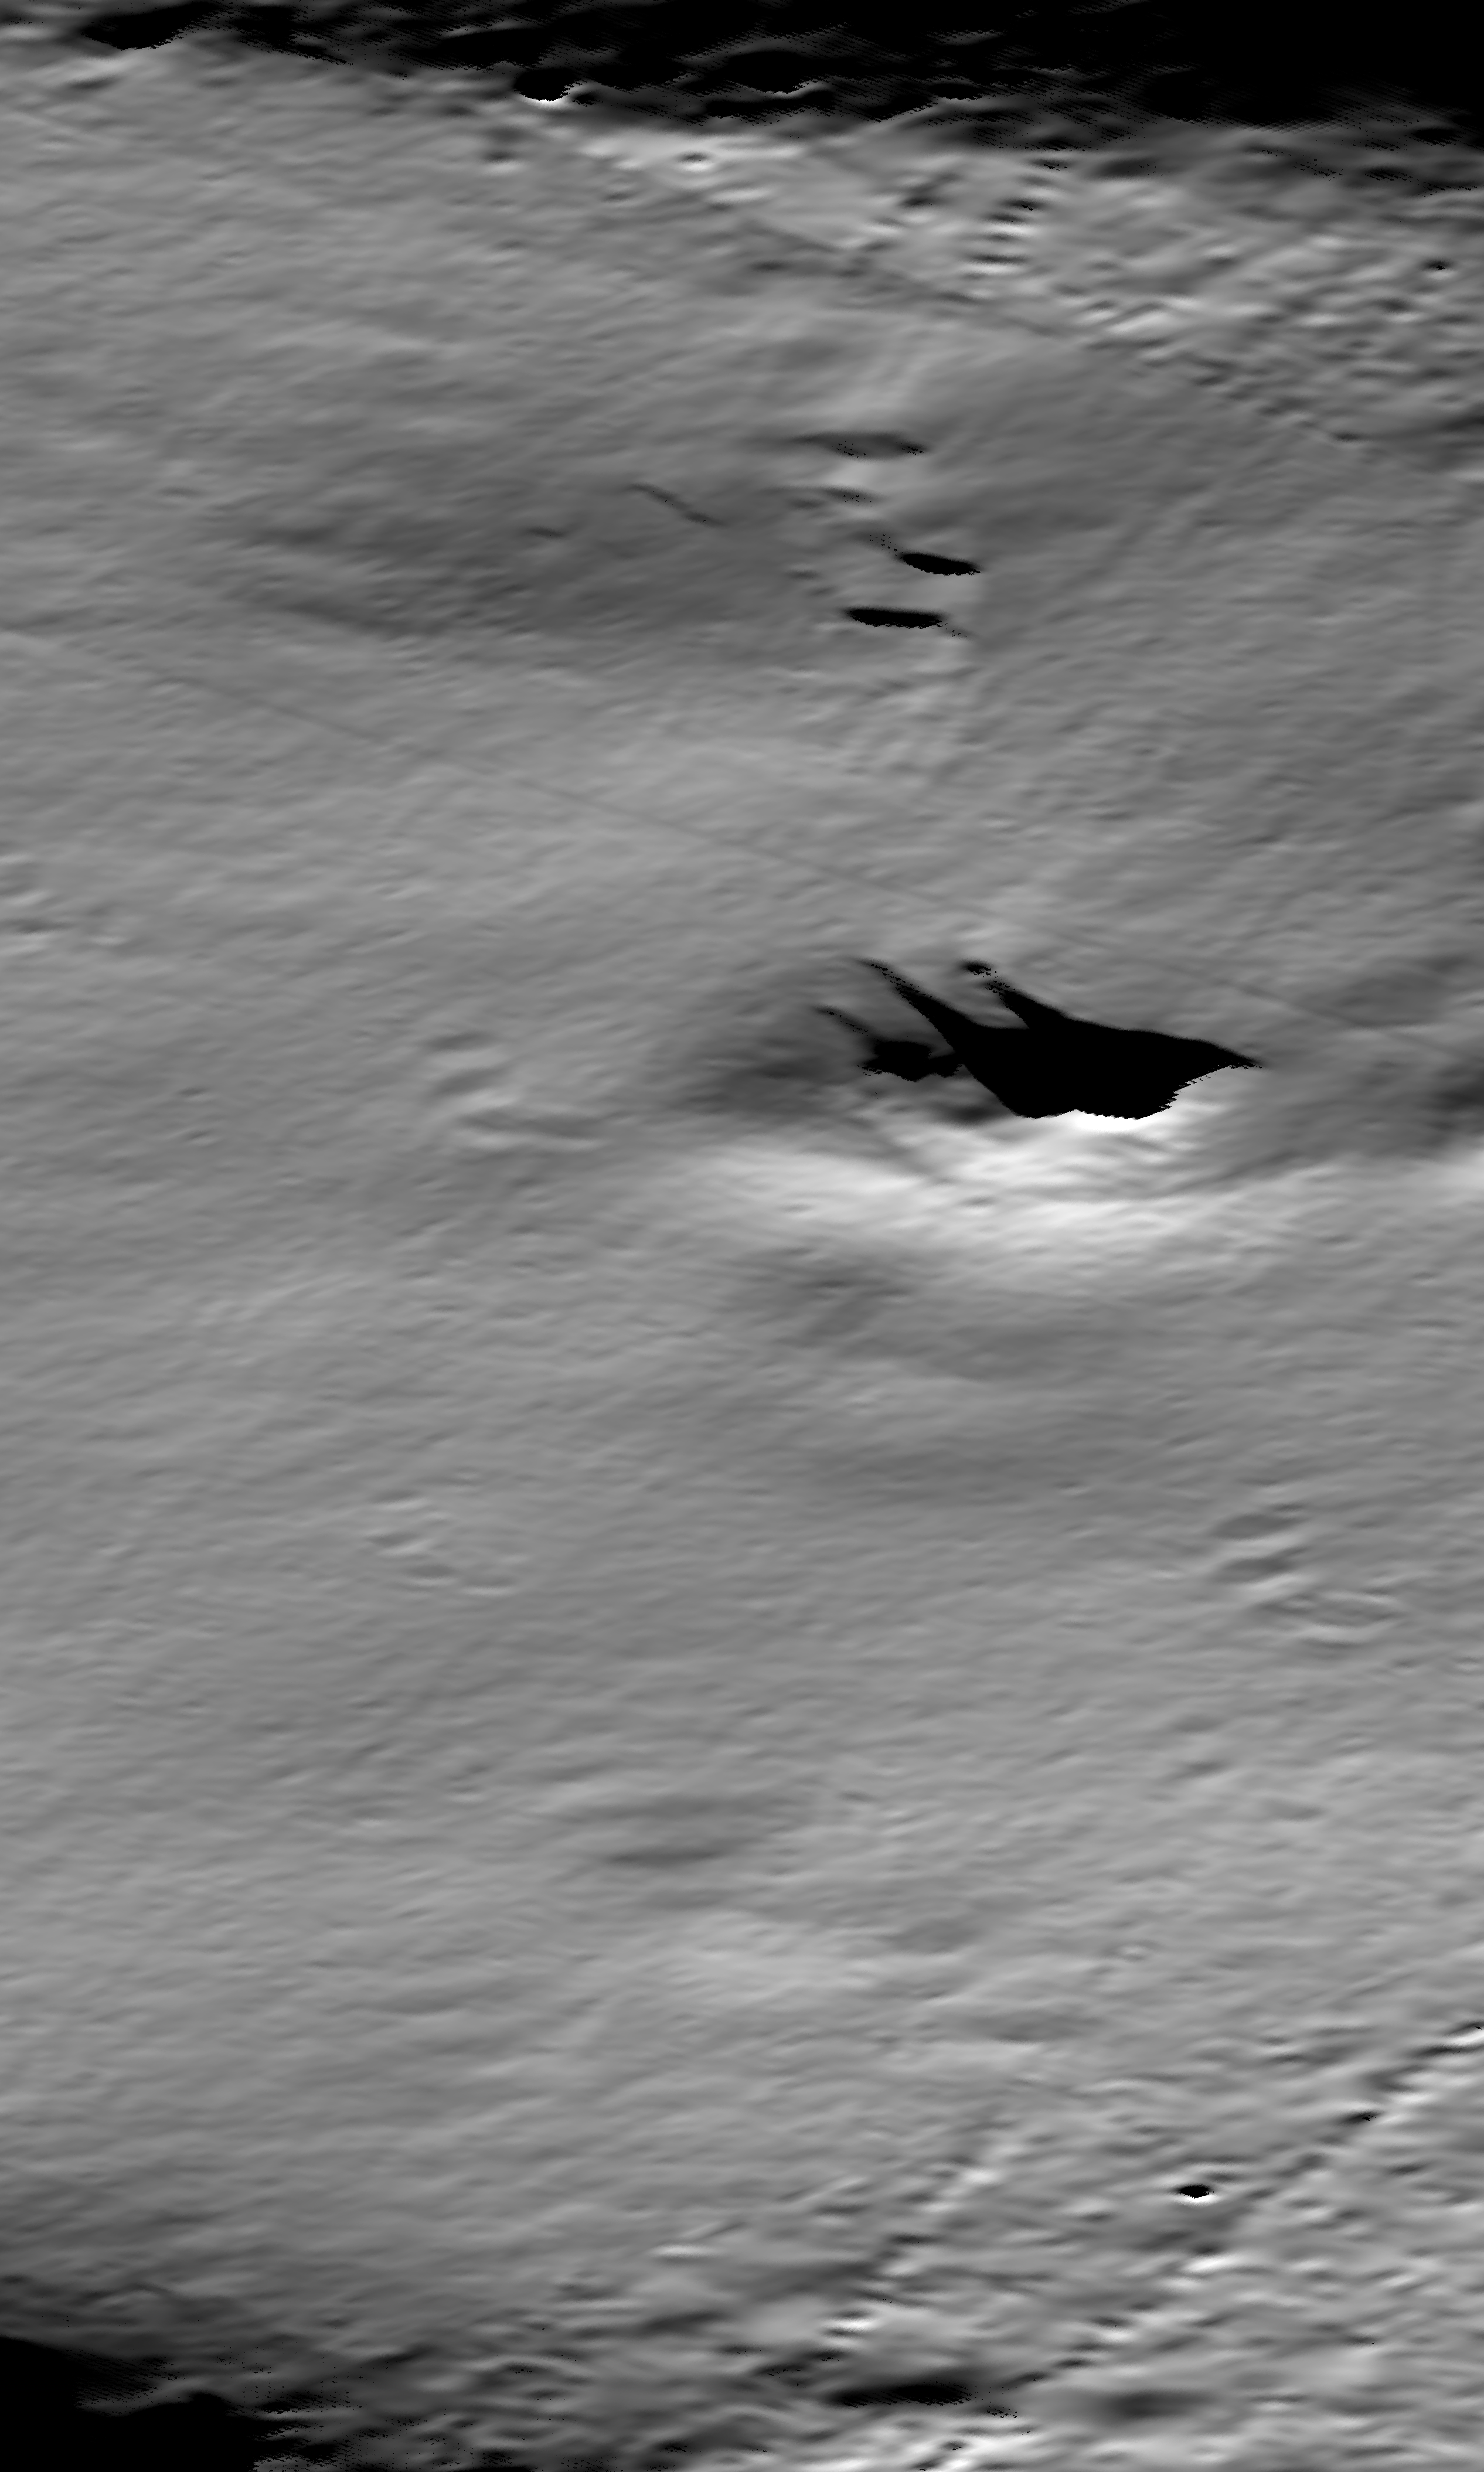
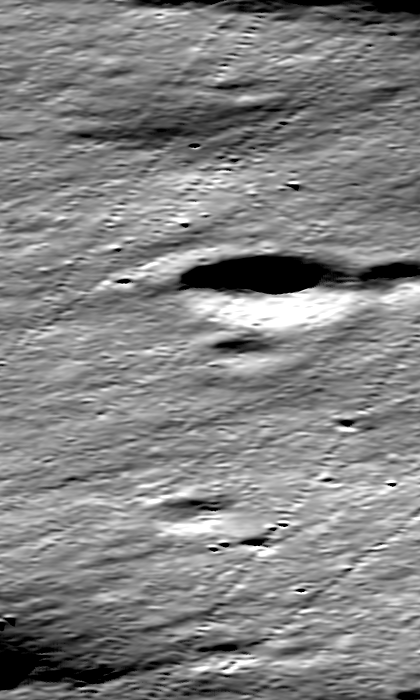
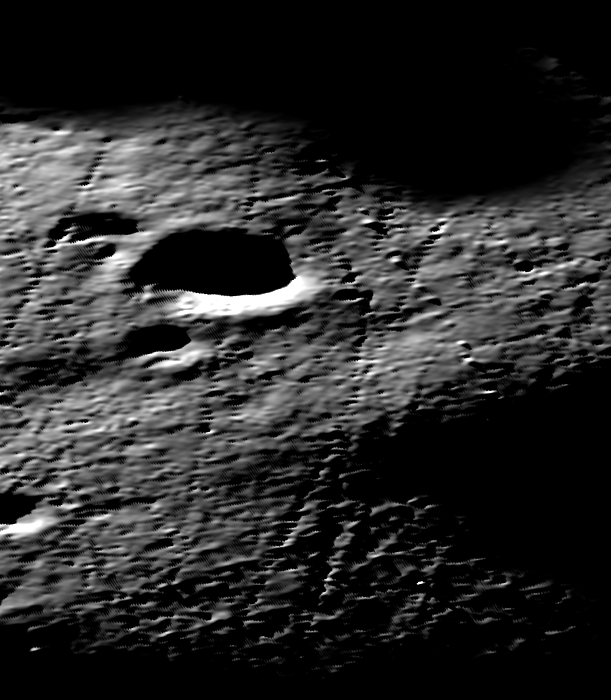
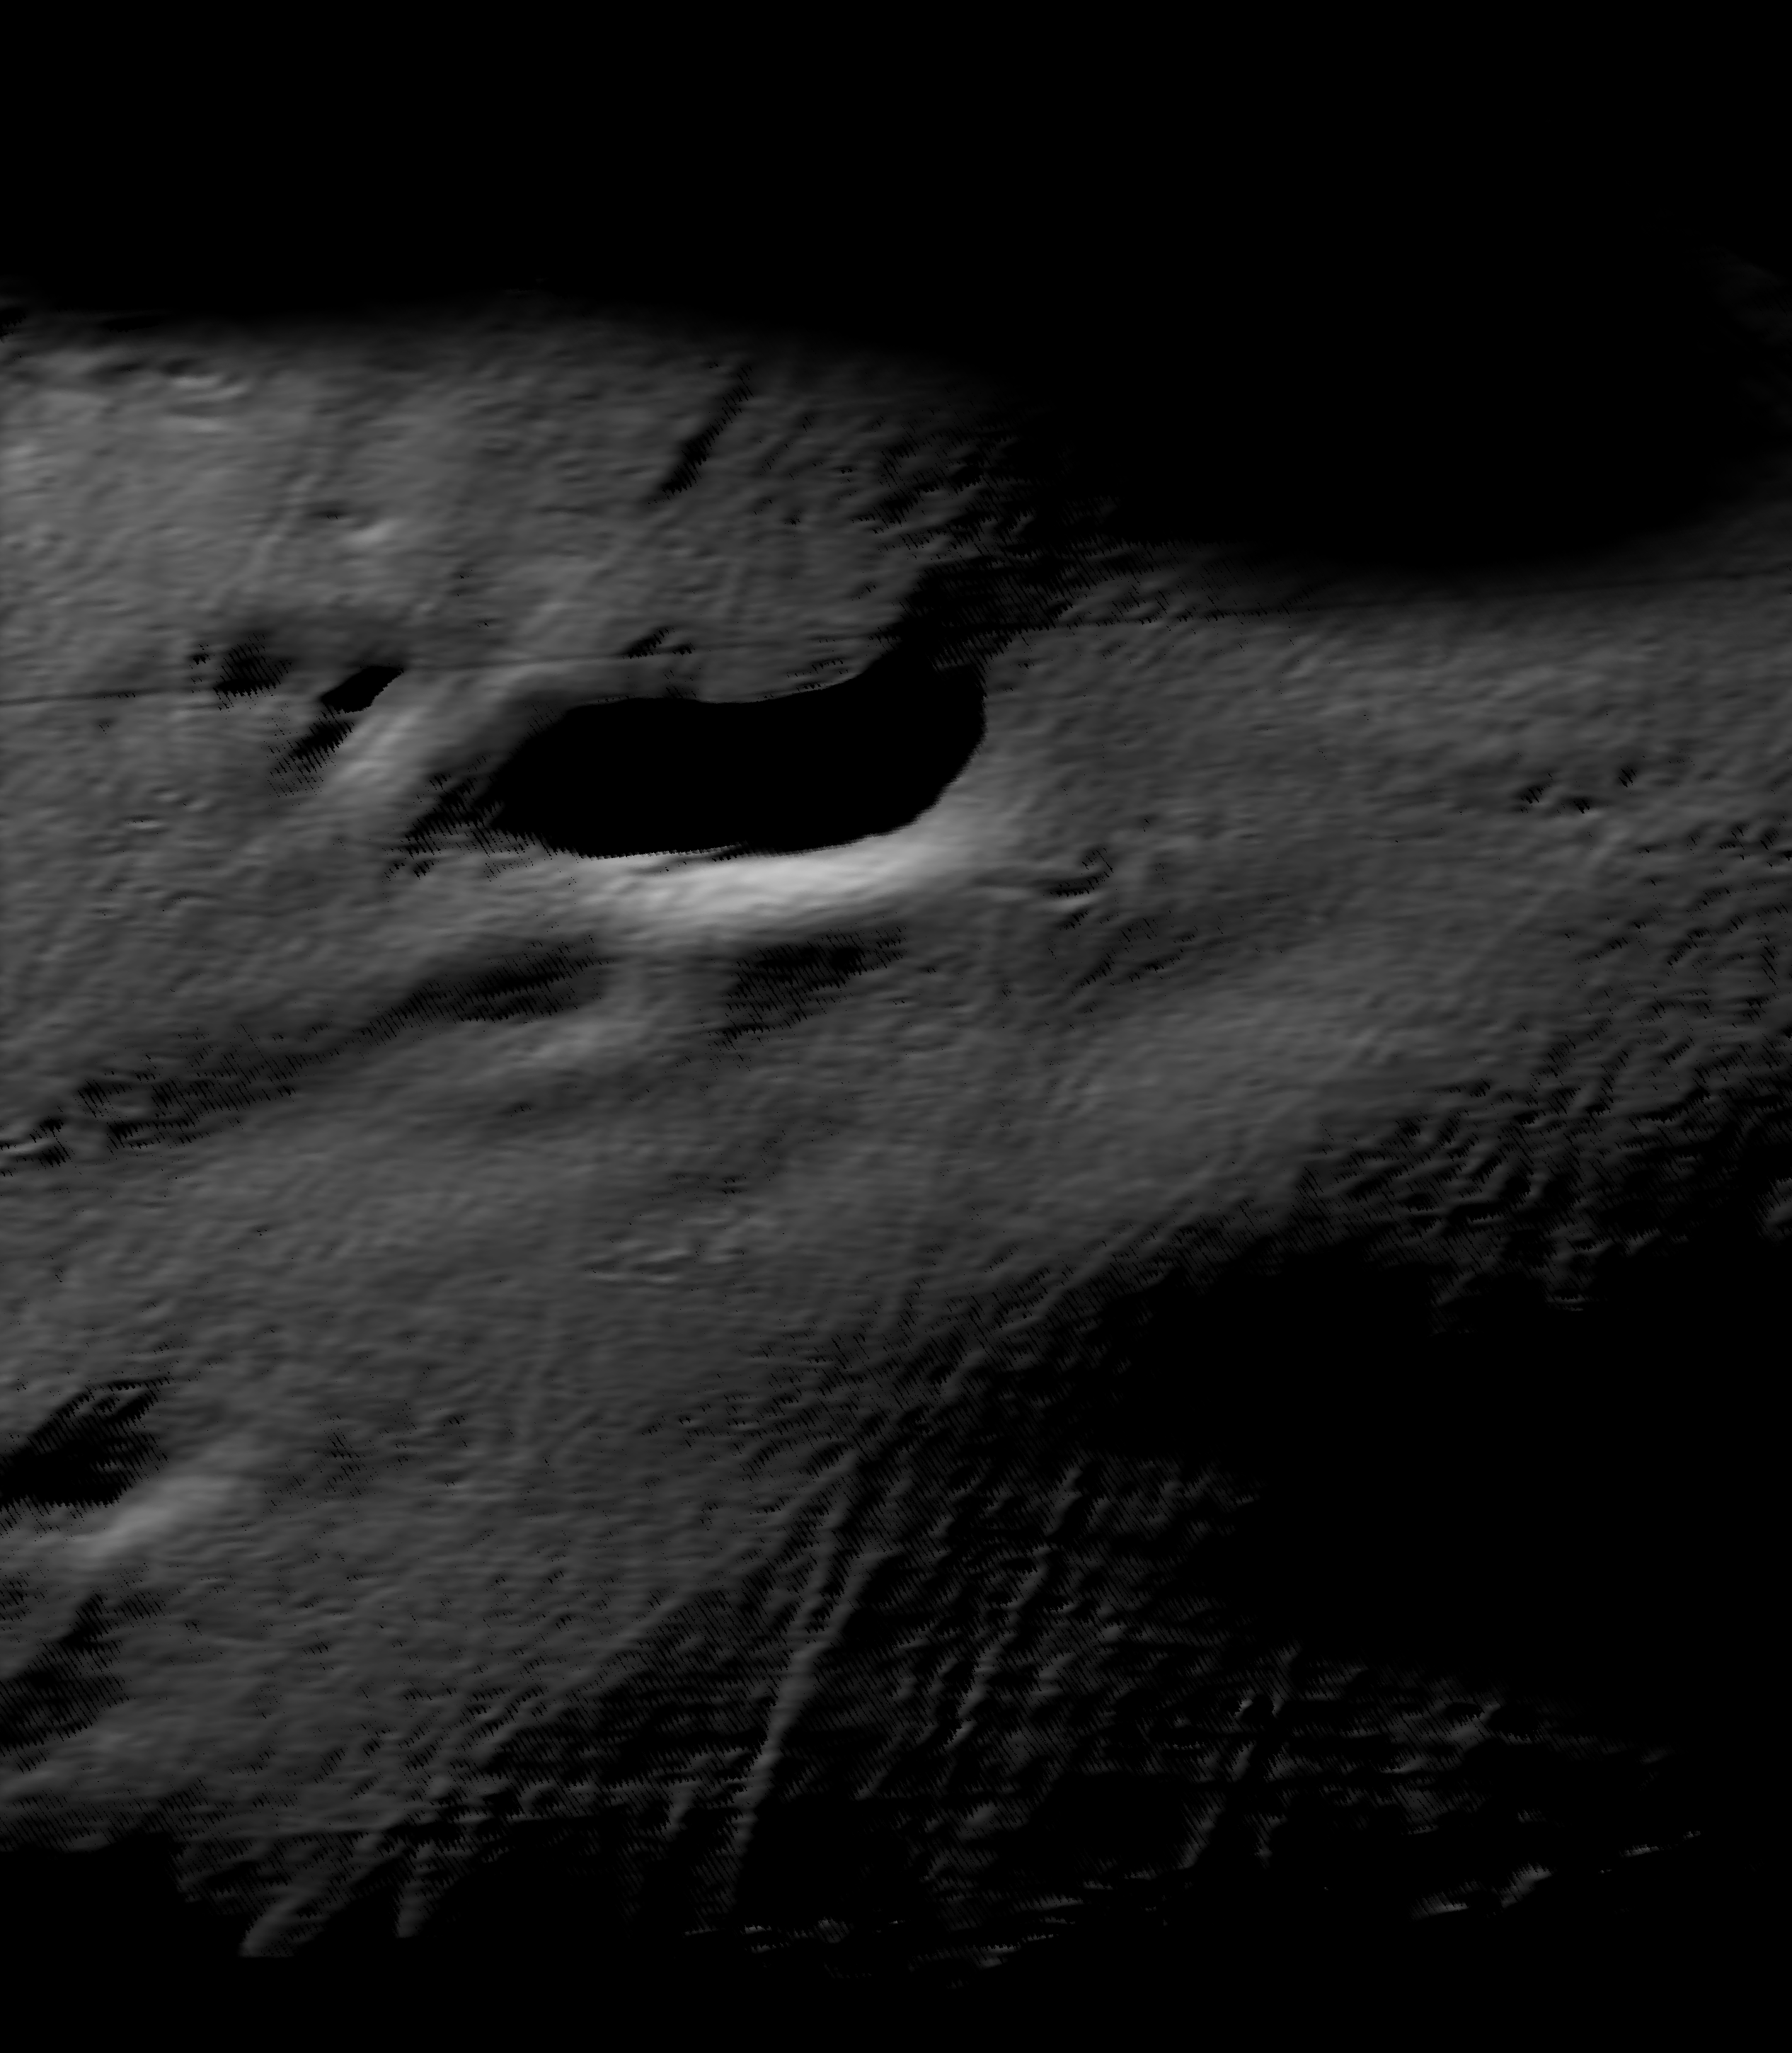
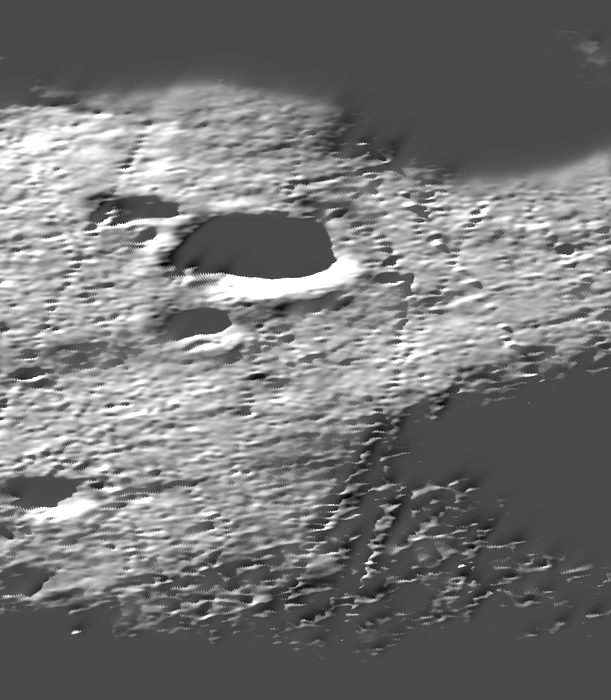
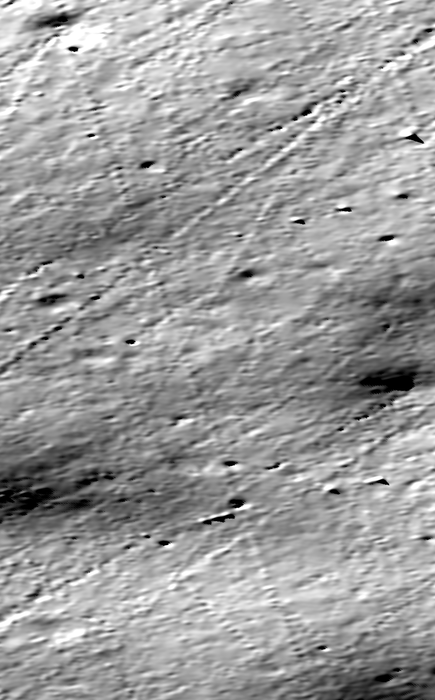
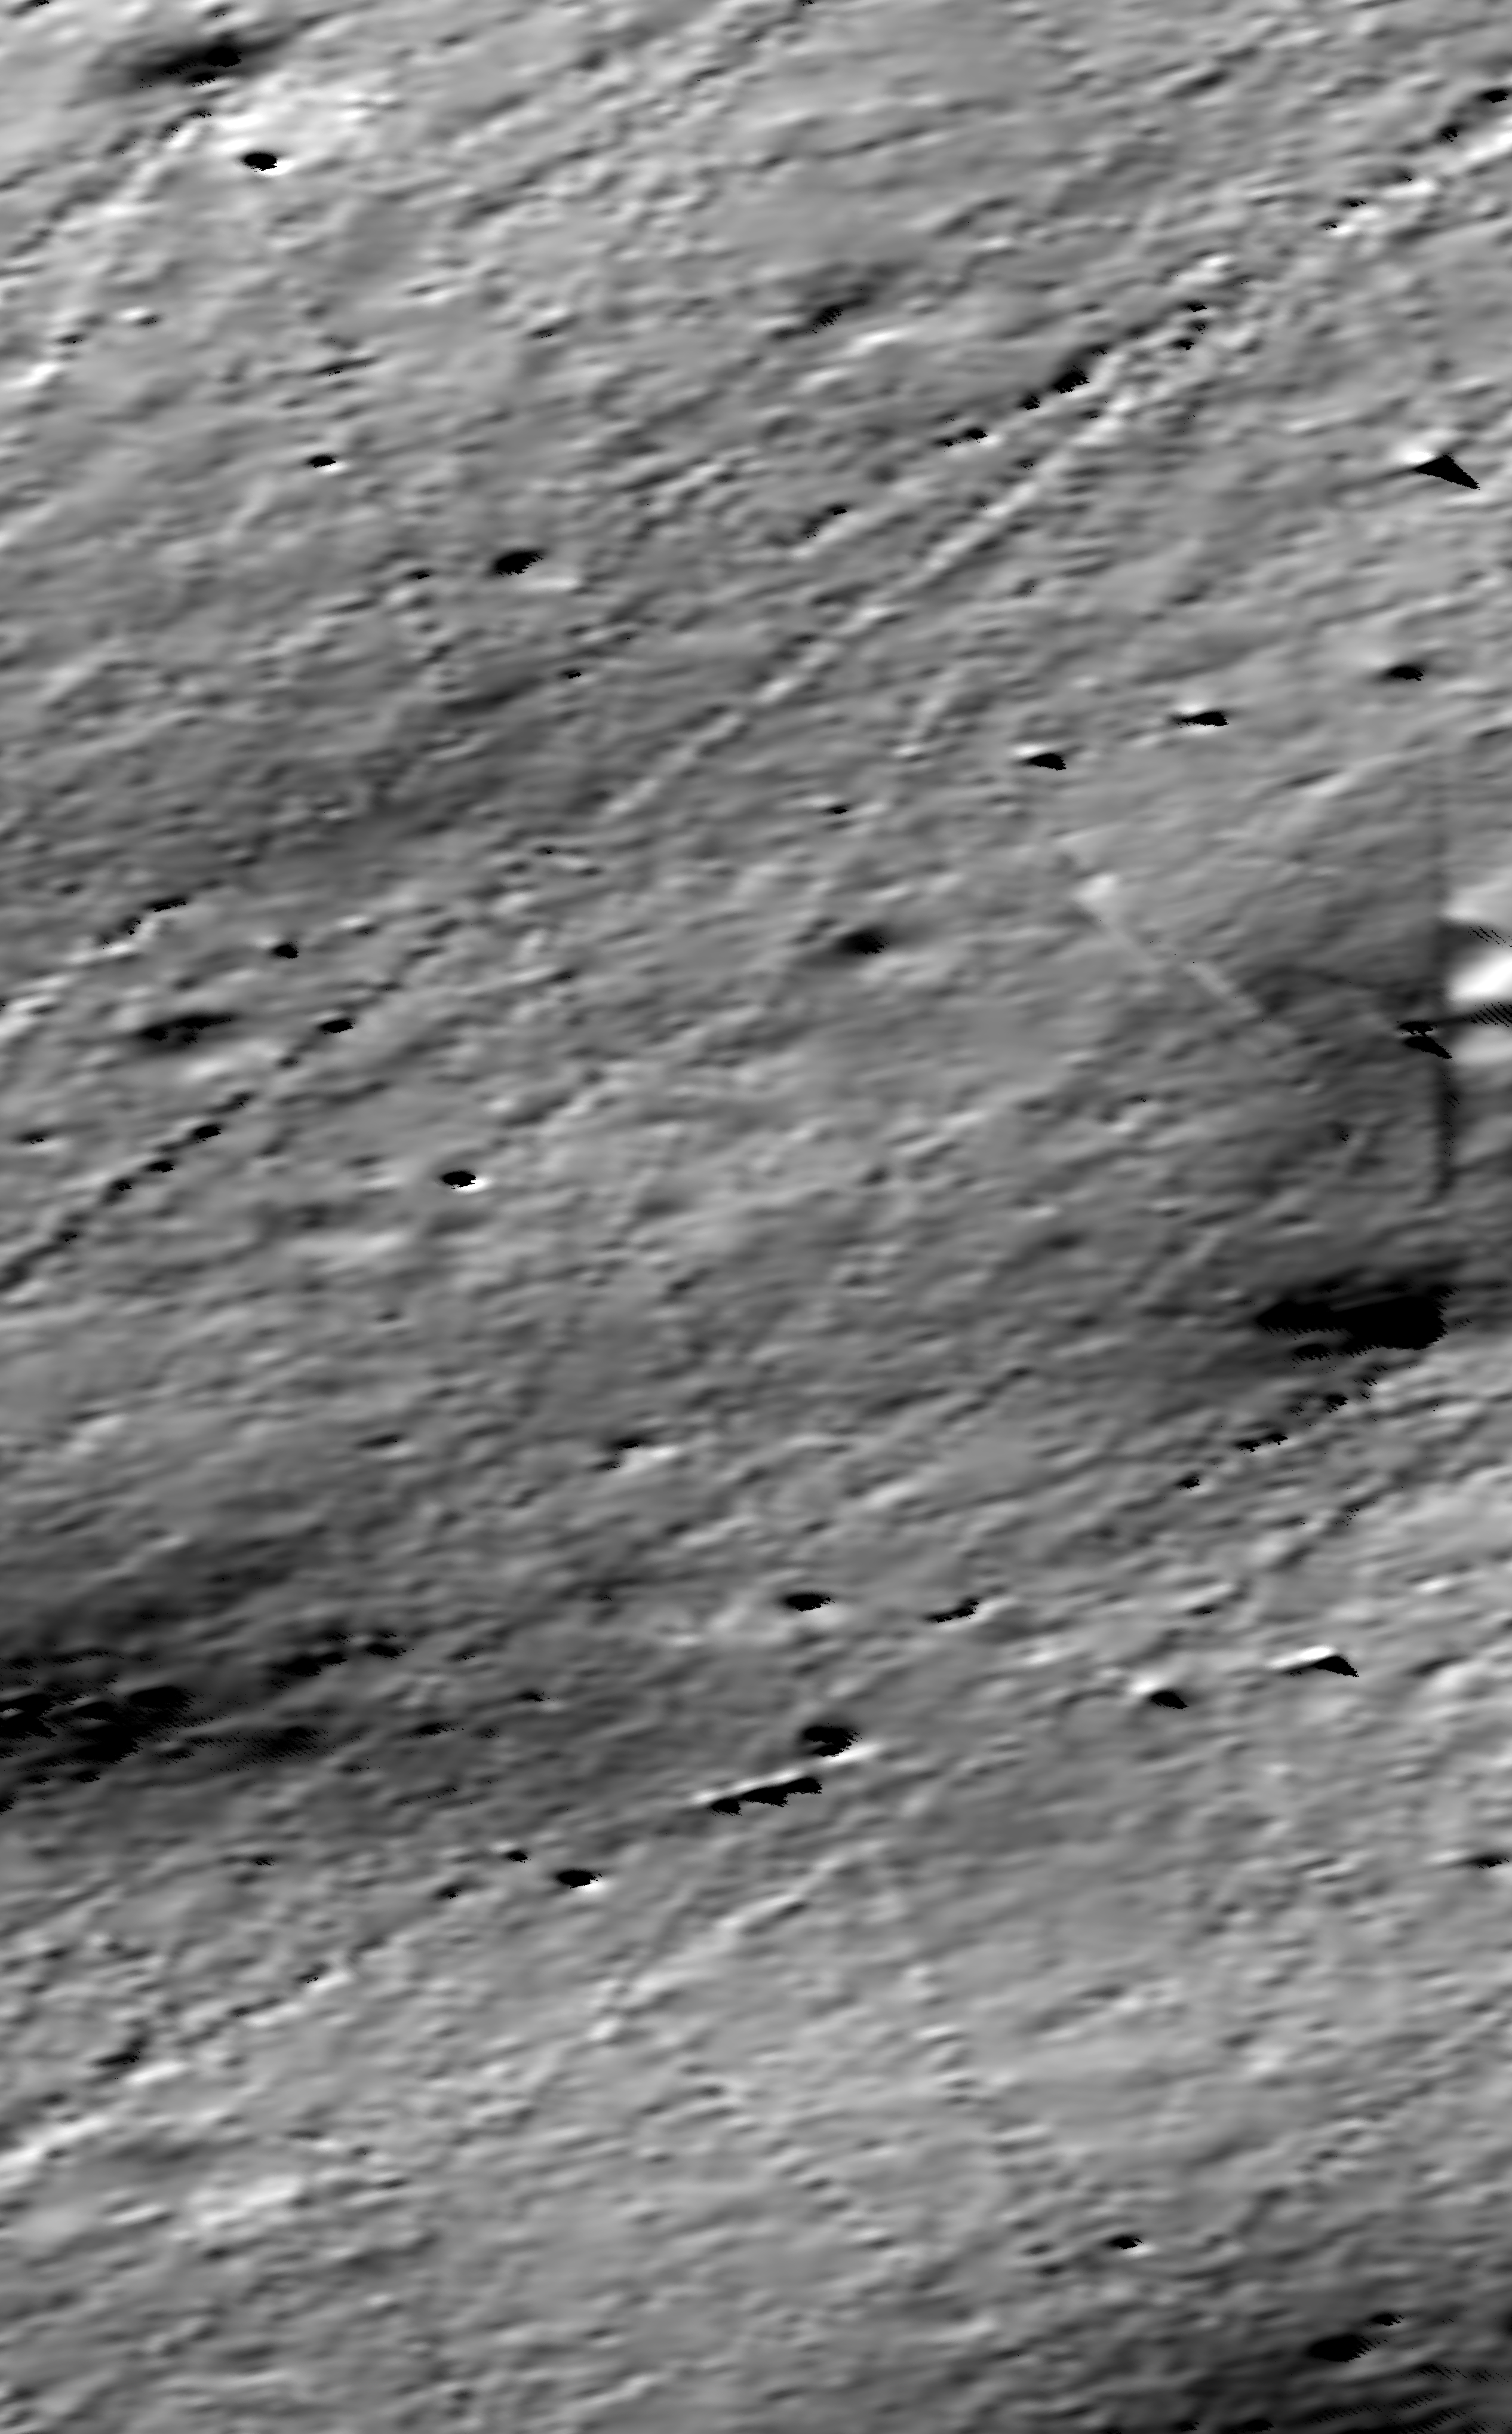
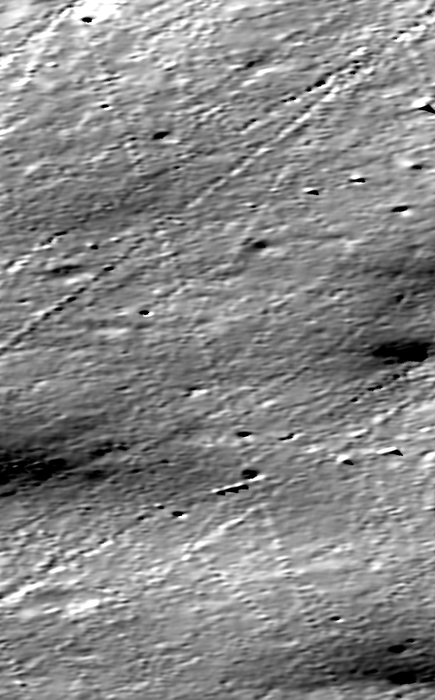
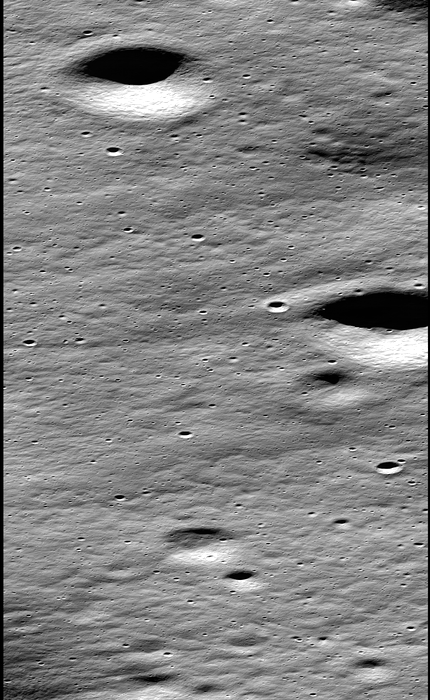
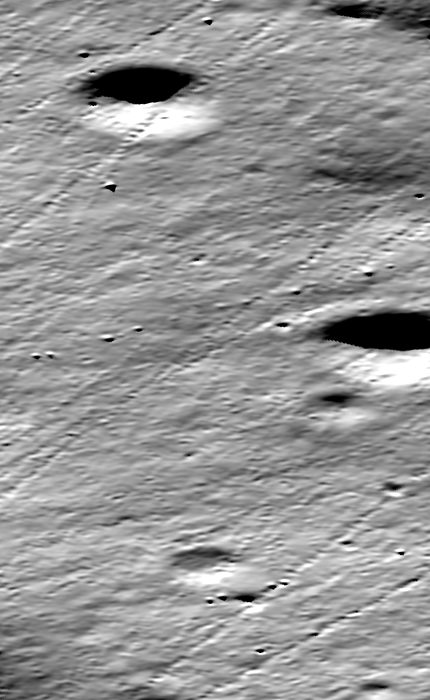
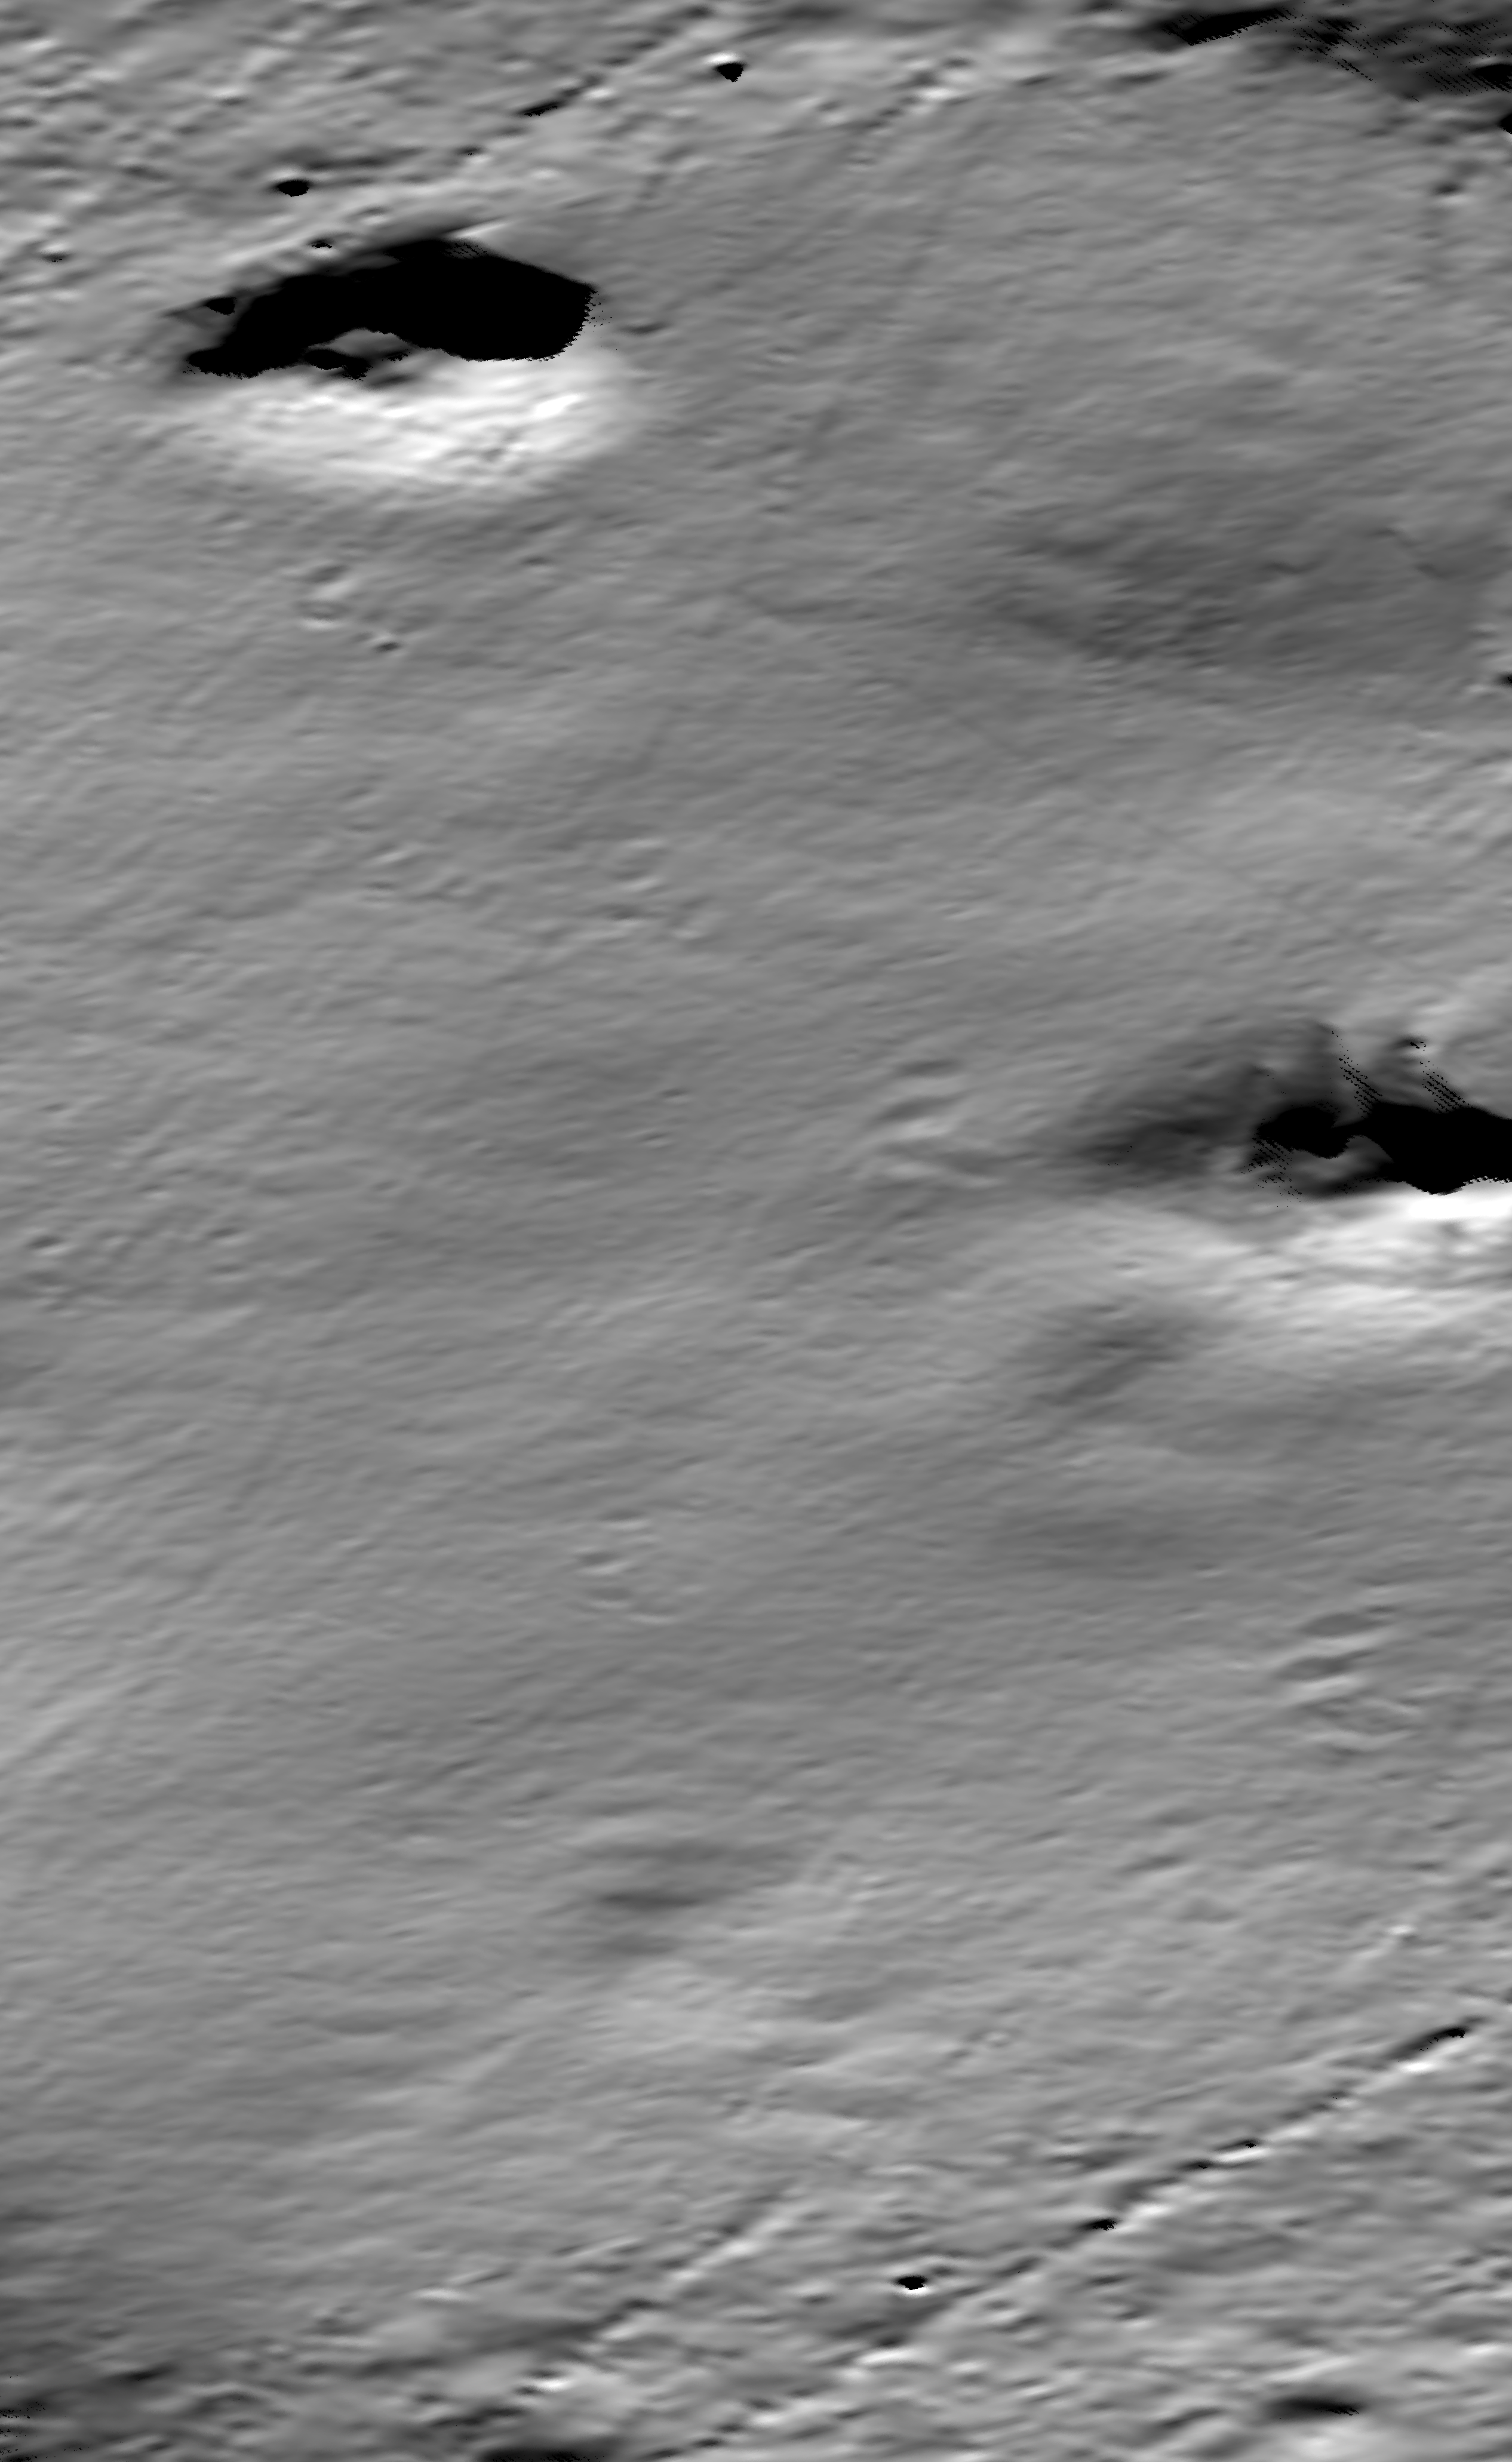
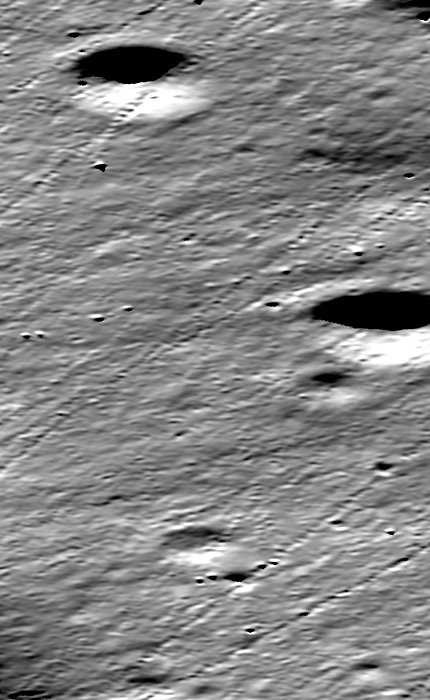
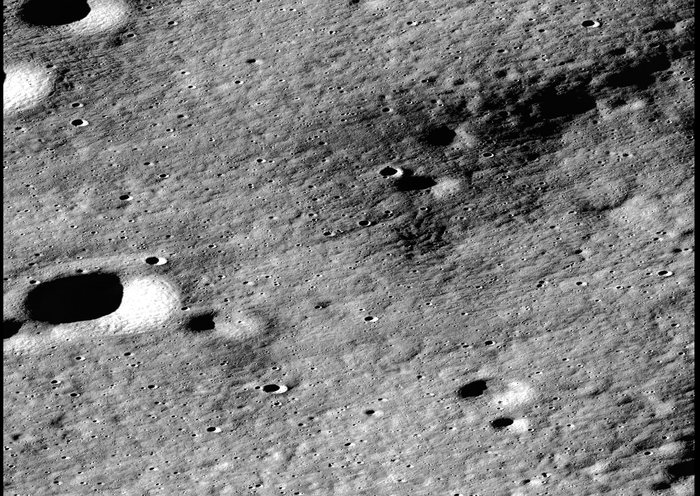
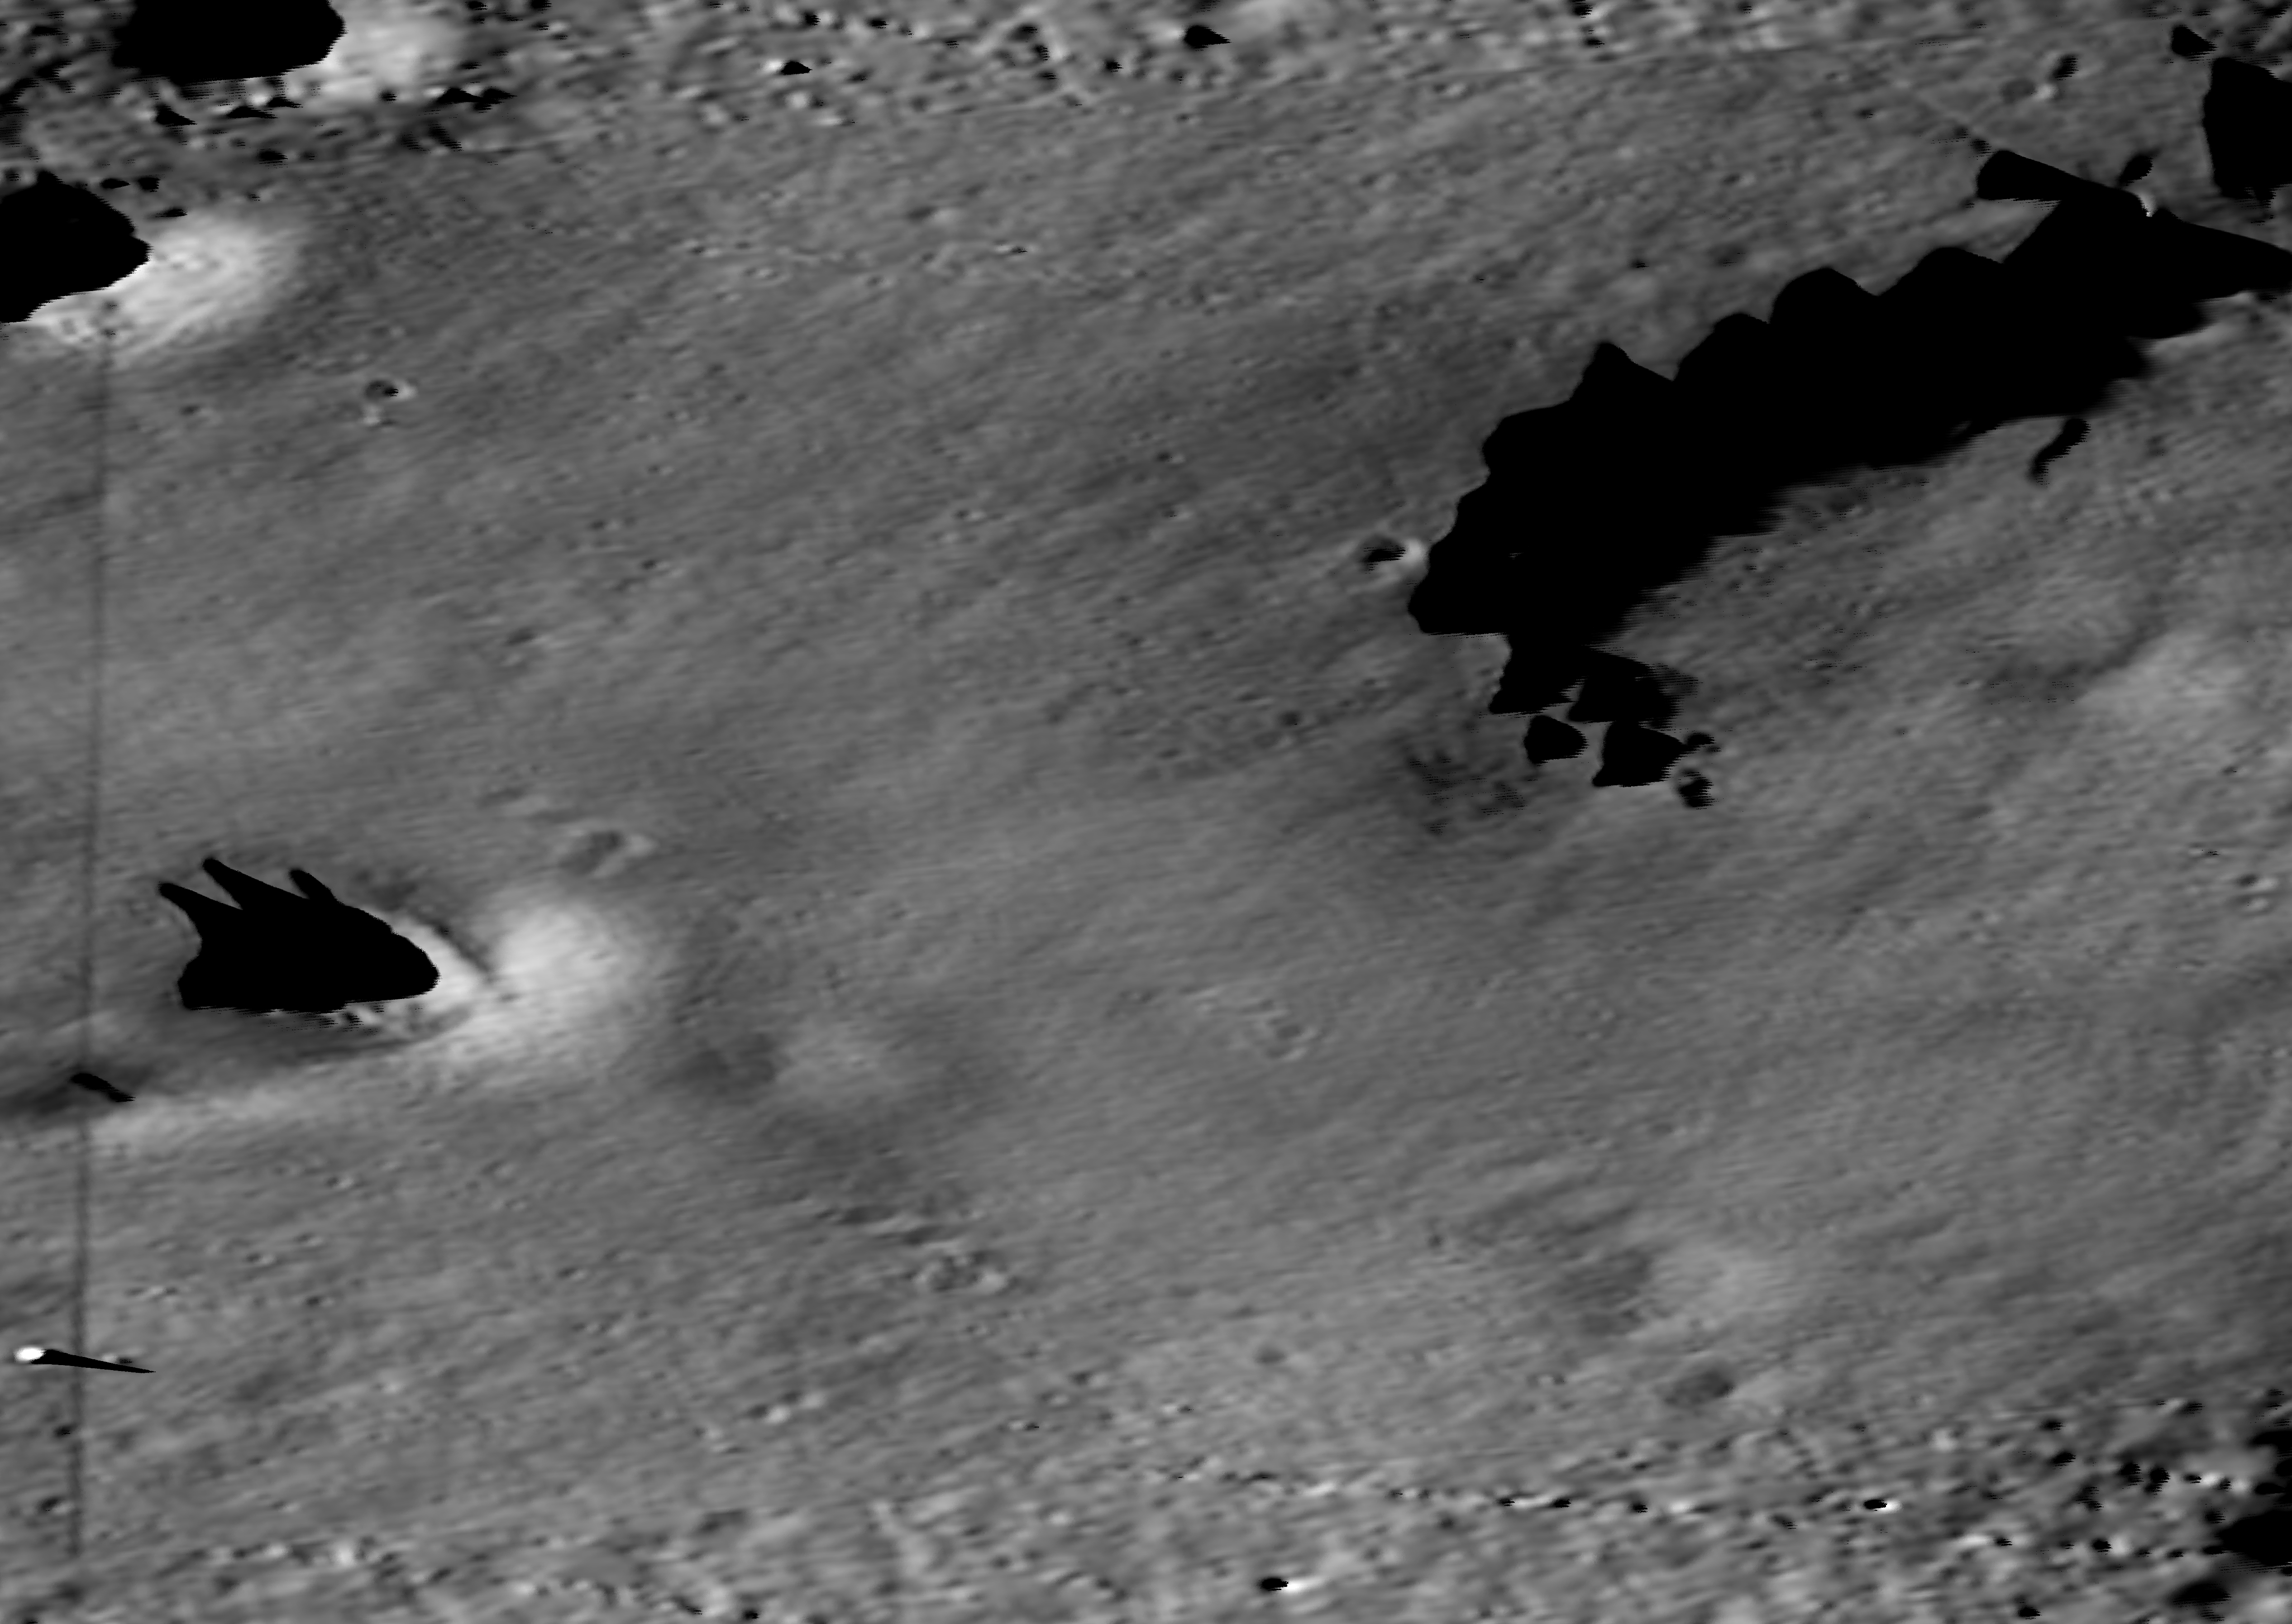
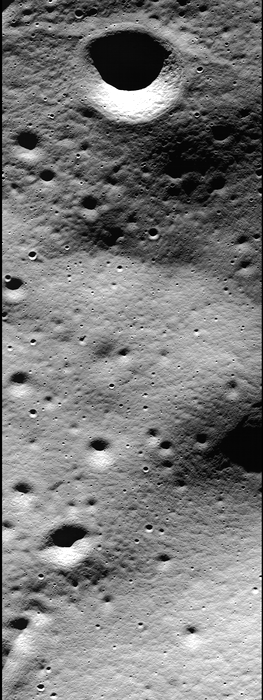
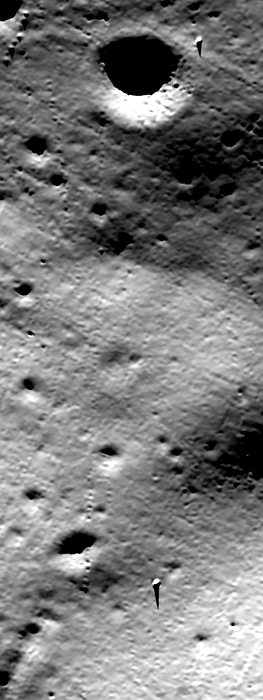
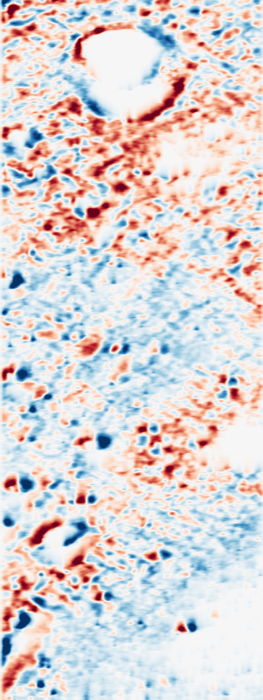
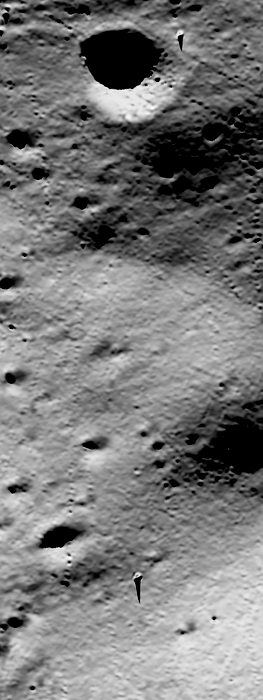
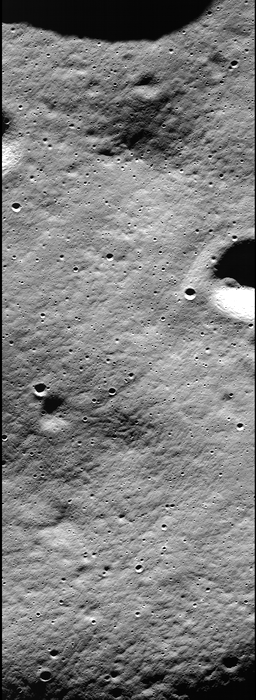
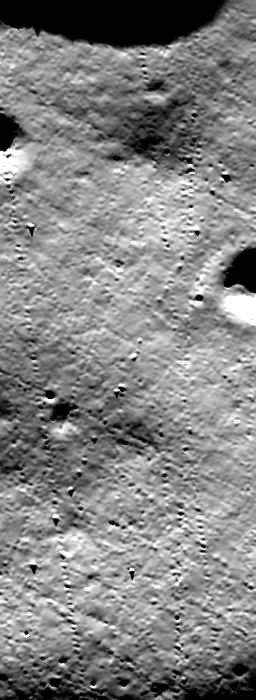
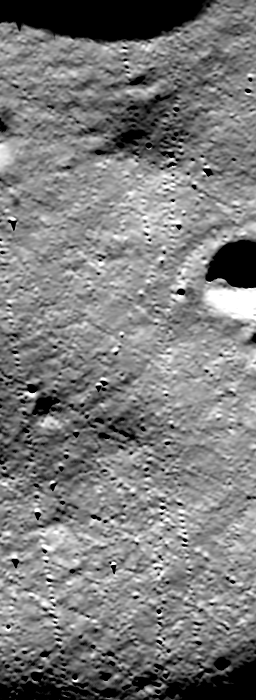
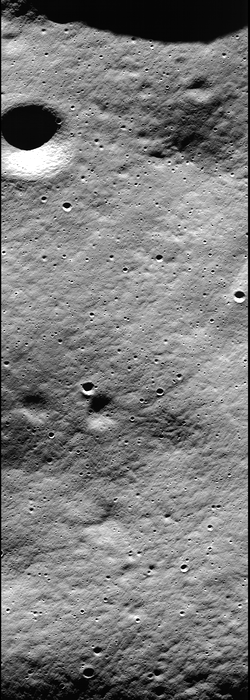
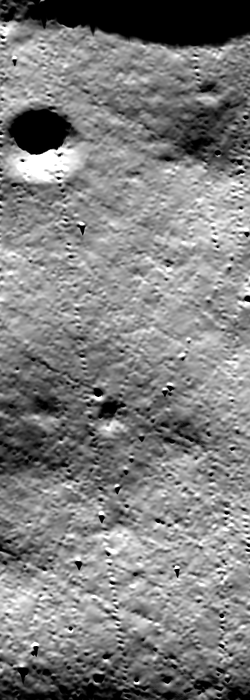
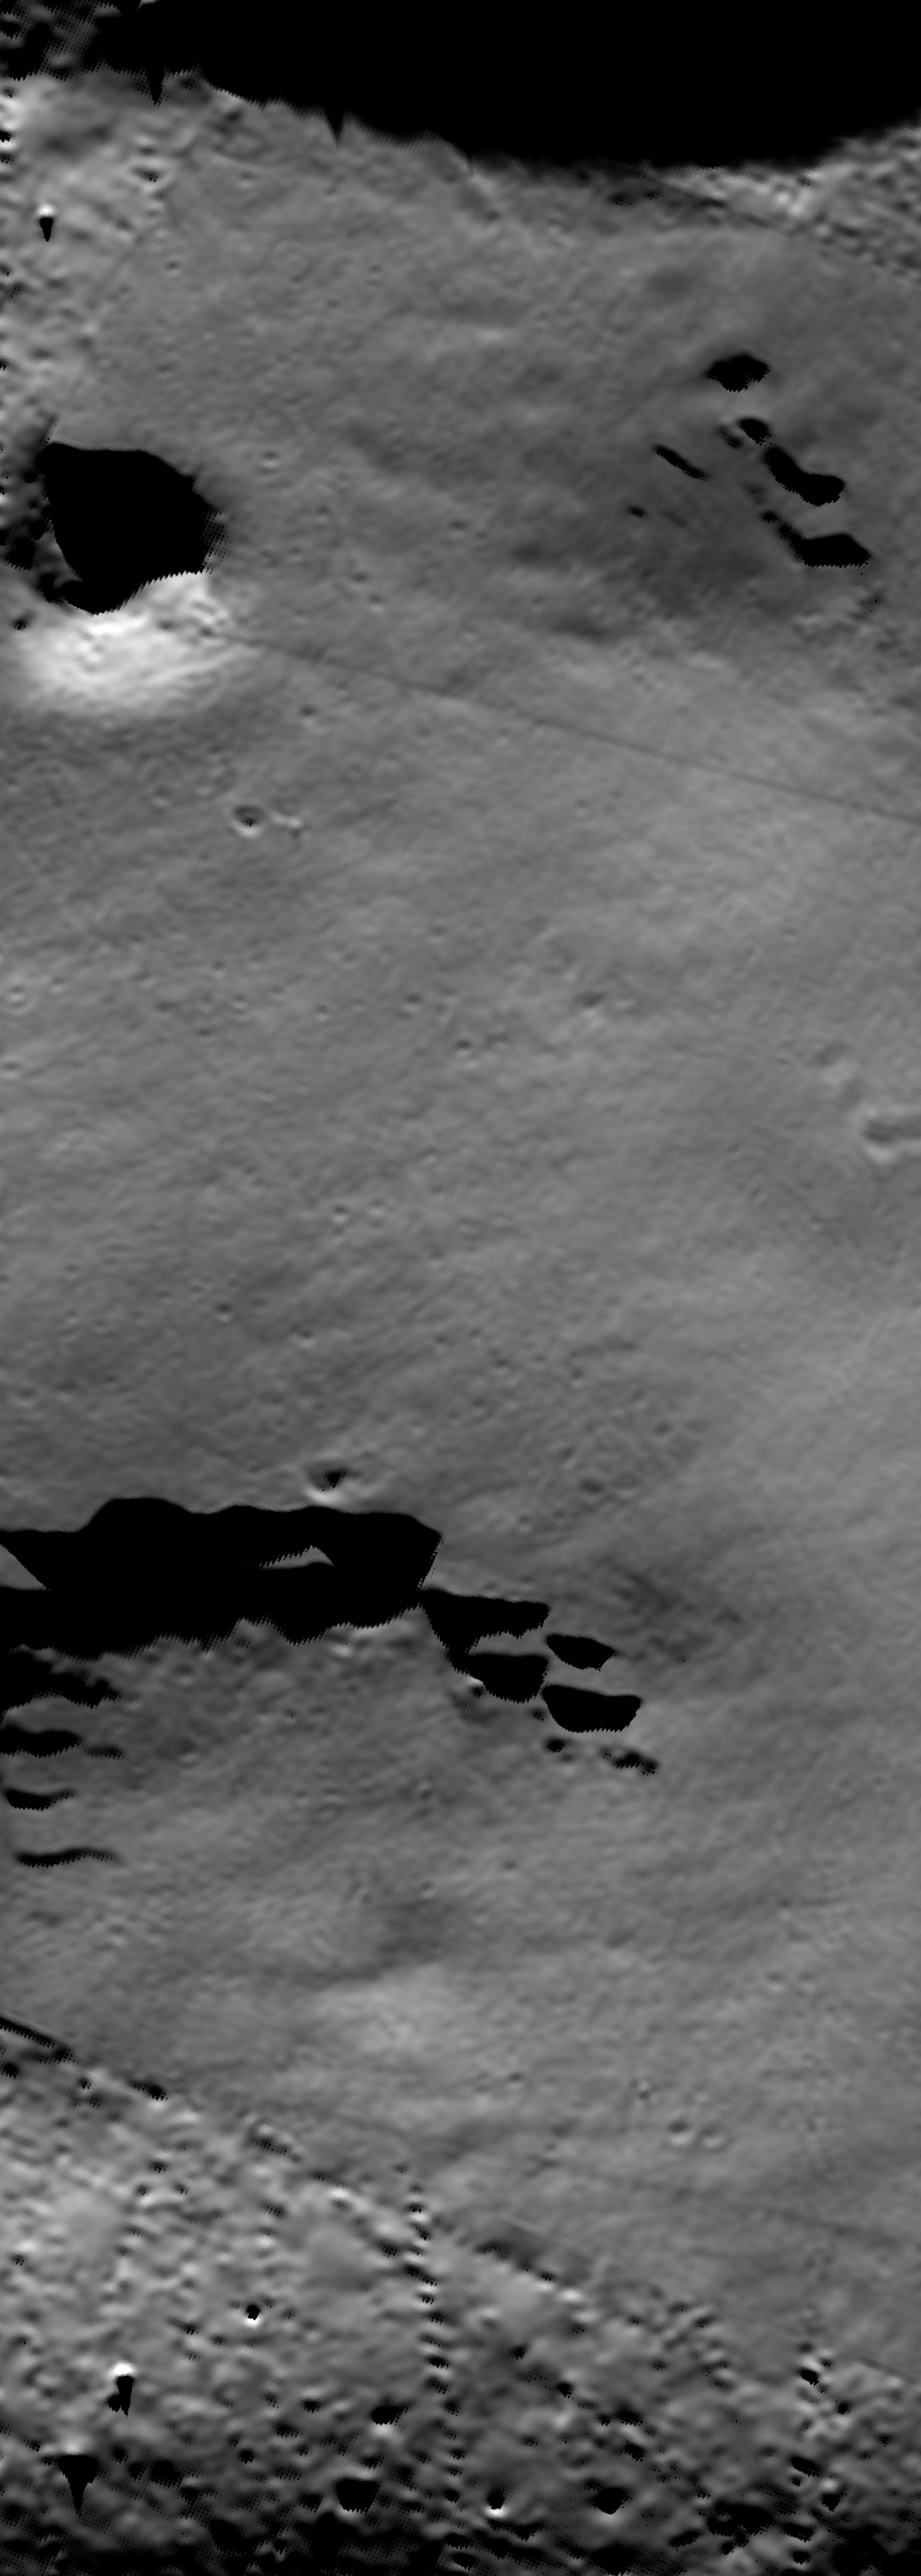
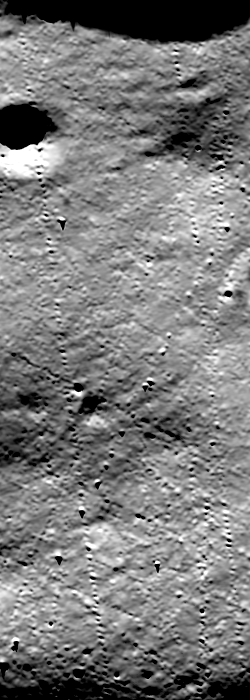
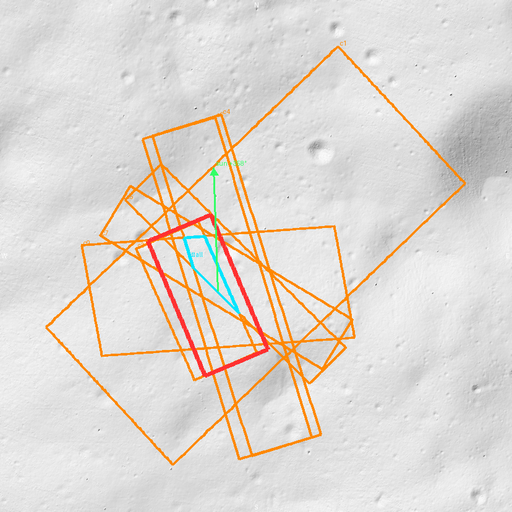
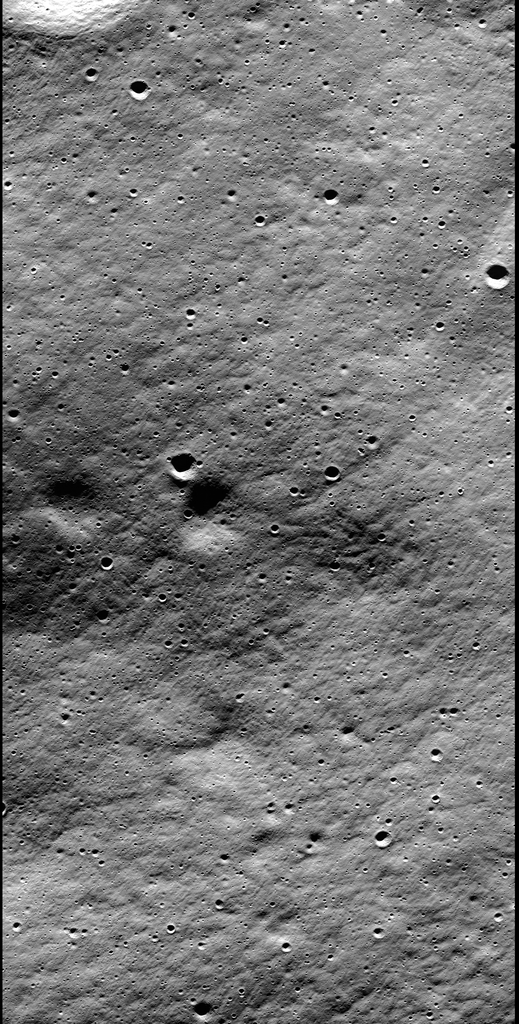
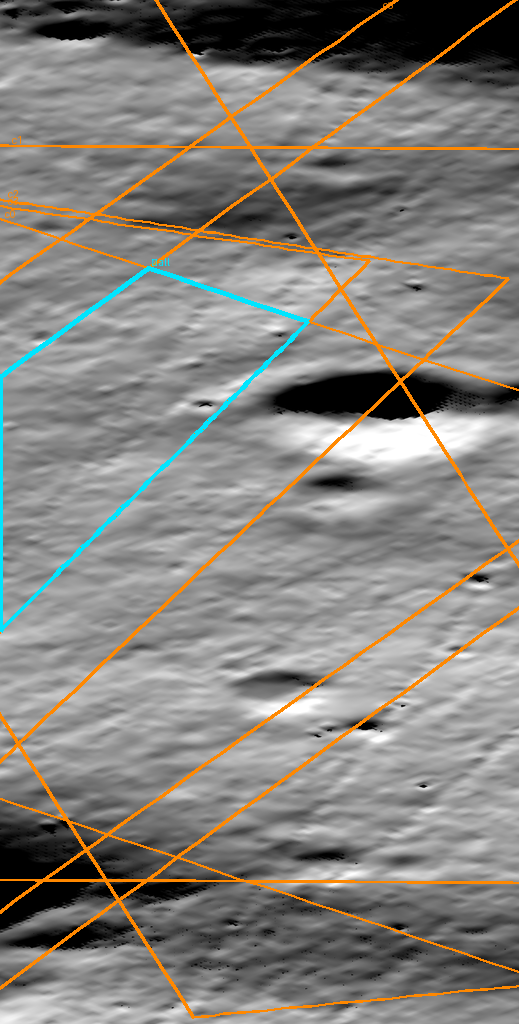
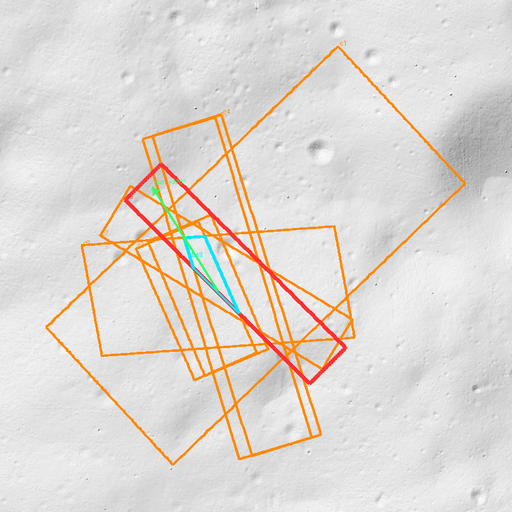
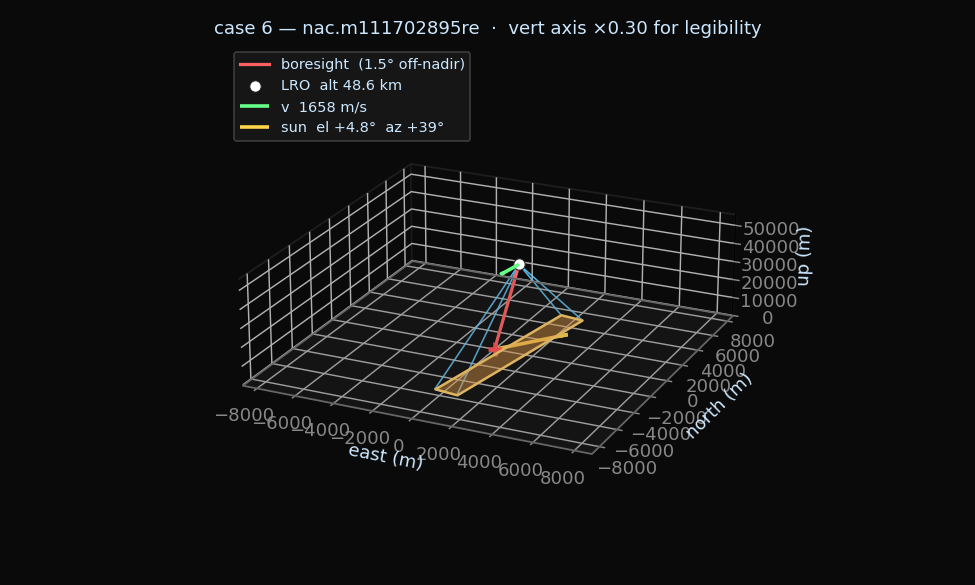
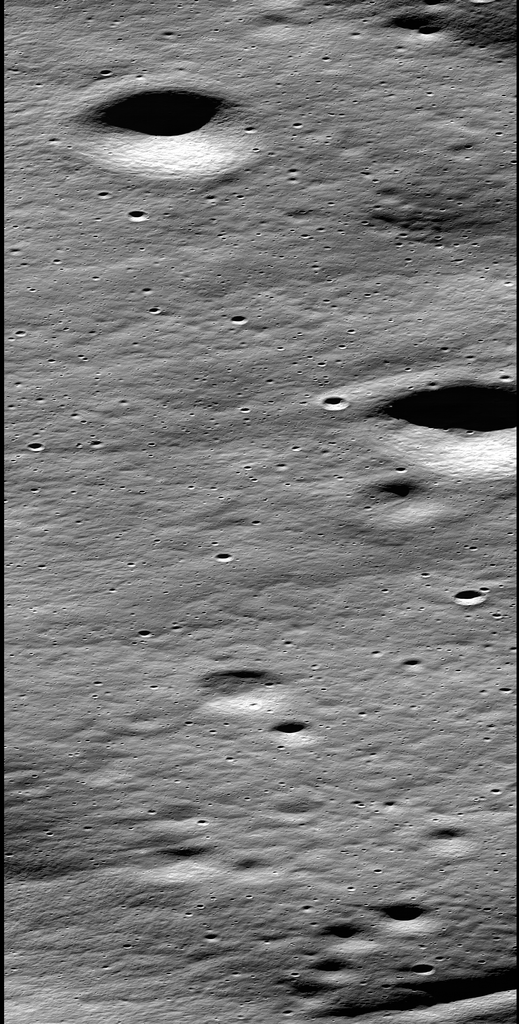
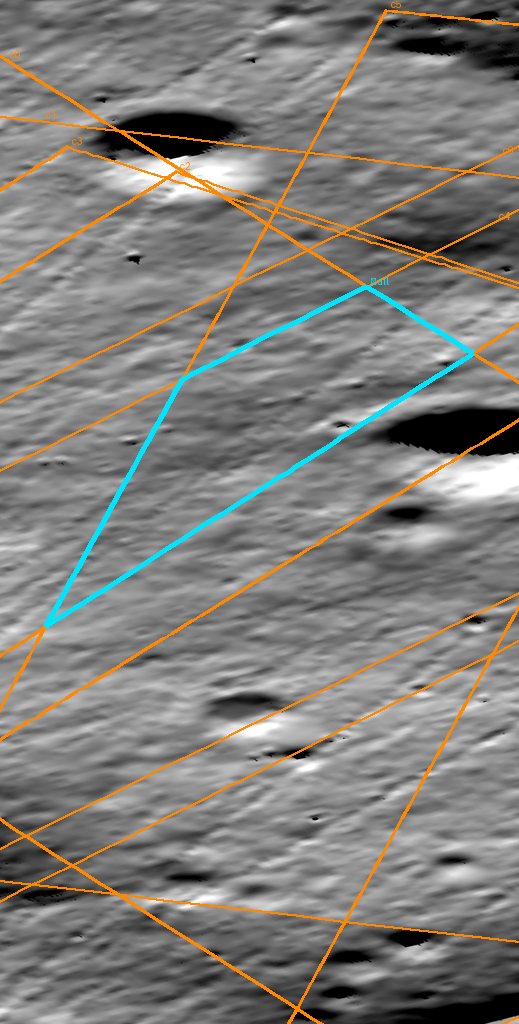
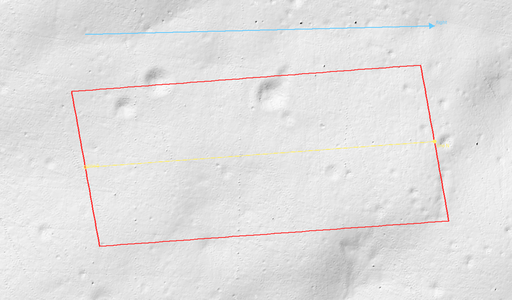
[31.2] v23 alignment diagnostic v2 -- Apollo 17 vs APENNINE01 (NAC vs L-S(truth-DTM) baseline xcorr, with explicit sun-direction arrow + N/E/W/S compass) updated 35d ago (2026-05-18 15:52)
Apollo 17 (v18 training set, peak floor 0.20 yields 14,649 tiles): baseline peaks 0.066-0.158, post-realign median 0.4. Truth-DTM per-cell |diff| median 1.55 m, p99 10.0 m.
APENNINE01 (v23 stage-4 smoke, peak floor 0.20 yields only 84 tiles): baseline peaks 0.024-0.094, post-realign median 0.21. Truth-DTM per-cell |diff| median 1.06 m, p99 7.3 m -- Apennine highlands are smoother than Taurus-Littrow valley, so the truth DTM has ~30 % less high-frequency relief for the xcorr to anchor on. Row 3 shows the one patch with a clear large crater visible in BOTH the NAC and the L-S panel -- and its peak 0.094 matches Apollo 17 baseline. Tiles without a comparable distinct feature in the 5 m truth do not correlate.
5-column layout per row: col 1 NAC reflectance @ 5 m (post-cam2map only, no realign field applied); col 2 Lommel-Seeliger render of the truth DTM patch at this NAC's sun (az, el); col 3 cos(i) Lambertian alternative; col 4 2-D phase-xcorr correlation surface (zoom ±40 px), cyan X marks peak; col 5 L-S translated by detected (dr, dc) -- should match col 1 if alignment is consistent. Yellow arrow = direction the SUN LIGHT ARRIVES FROM, drawn from the rim of the panel inward; blue compass rose top-left = N/E/W/S on this north-up image (truth-DTM npz has transform.e < 0). Driver: drivers/smoke/v23_alignment_diag_v2.py. Compared to v1 of this card, v2 fixes (a) an axes-coords y-flip in the sun-arrow direction, (b) the diagnostic's sun_az source (was sourced from the shard's post-mirror-flip sun_az_deg; now sourced from per-NAC geom.parquet via common.nac_sun_geom.sun_az_el_for_nac_at evaluated at the truth-DTM centre), and (c) figure sizing so every panel is rigorously square. The actual v23 build pipeline (orchestrator phase 6) already used physical sun_az -- only this diagnostic card was wrong. With the fix in place, morning-NAC patches (sun ESE ~110 deg) and afternoon-NAC patches (sun WSW ~250 deg) on APENNINE01 produce baseline xcorr peaks in the same range as Apollo 17.
[30.1] LROC NAC DTM catalog vs Apollo 17 latitude (global) updated 36d ago (2026-05-17 21:57)
All 656 LROC stereo NAC DTMs in the 2026-03-15 catalog release plotted on a global equirectangular map. Yellow = "Apollo-17-equivalent quality" (resolution ≤ 5 m, LOLA-residual RMS ≤ 2 m, footprint ≥ 100 km², ≥ 1 stereo pair) -- 321 of 656 pass this filter. Grey = below-spec. Red star = our training site (APOLLO17 in the catalog: lat=+20.35°, cov=2415 km², res=5 m, lola_rms=1.77 m). Red bands = Apollo 17 lat ±{2, 5, 10}°; blue bands = southern mirror lat ±{2, 5, 10}° (counted together as "same |lat|"). Right column: per-band counts table and footprint-area distribution within the ±5° band, with Apollo 17 area marked. Source: pds.lroc.im-ldi.com/.../NAC_DTMS/NAC_DTMS_360.ZIP. Driver: drivers/smoke/nac_dtm_catalog_card.py.
All 14,649 v18 training tiles plotted on the LOLA-controlled Apollo 17 NAC-DTM (5 m hill-shade backdrop). Each tile is one dot, coloured by parent NAC (65 NACs total, tab20 cyclic palette). Black box = full truth-DEM footprint; red dashed box = bounding box of training tiles. Right column: per-NAC tile count (top 20) and a 2D tile-density heatmap on a 0.02° (~0.6 km) grid -- shows which parts of the AOI are oversampled and where coverage thins out. Driver: drivers/smoke/nac_groundtracks_card.py.
[30.3] Sun locations across the v18 training set (polar el/az map) updated 36d ago (2026-05-17 21:32)
All v18 training tiles plotted by sun azimuth (theta, compass convention -- N up, increasing CW) and co-elevation (radius = 90° - sun_el, so zenith is at centre and the outer ring is the horizon). Mirror_flip=False tiles (orange) keep the stored sun_az_deg as-is; mirror_flip=True tiles (blue) had their NAC + DEM E-W-flipped at build time so the effective training-time sun direction is the reflected one. Side panels: sun_el and local-solar-hour histograms by mirror status. Driver: drivers/smoke/sun_locations_card.py.
[30.4] v20.2 @ 10->5 m (transfer - v20.2 weights on rebuilt v22 dataset) updated 36d ago (2026-05-17 21:28)
SAME v20.2 checkpoint applied two octaves finer than the training scale: rebuilt v22 dataset (dem_lo at 10 m, dem_hi/nac_hi at 5 m). Same 7-col layout as the 40->20 and 20->10 cards. Both datasets are post mirror-fix and bilinear-fix (2026-05-17). median model RMSE 137 mm, bilinear baseline 117 mm, improvement 0.85x.
[30.5] v20.2 @ 20->10 m (transfer - v20.2 weights on rebuilt v21 dataset) updated 36d ago (2026-05-17 21:28)
SAME v20.2 checkpoint (trained on the rebuilt v18 40 m -> 20 m dataset) applied directly to the rebuilt v21 dataset (dem_lo at 20 m, dem_hi/nac_hi at 10 m). This is the TRANSFER experiment: no v21-specific retraining, just inference on val. Both datasets are post mirror-fix and bilinear-fix (2026-05-17). Canonical 7-col layout: dem_lo relief (20 m); dataset nac_hi (10 m); dem_hi relief (10 m); DEM correction (target - bilinear) = dem_hi - bilinear_2x(dem_lo); predicted correction (model - bilinear) = pred - bilinear_2x(dem_lo) sharing vmin/vmax per-row with col 4 for direct comparison; NAC reflectance @ 0.5 m via reinterp_nac_raw_at_grid_gpu (native 640 px); model error (= predicted correction - ground-truth correction). median model RMSE 230 mm, bilinear baseline 250 mm, improvement 1.09x.
[30.6] v20.2 @ 40->20 m (native) - v17low RCAN-UNet on rebuilt v18 dataset (best/worst/median val patches) updated 36d ago (2026-05-17 21:28)
v20 architecture retrained as v20.2 on the rebuilt v18 dataset (post mirror-fix and bilinear-fix, 2026-05-17 -- the build code is now lattice-correct: dem_hi[0::2,0::2] == dem_lo exactly). Canonical 7-col layout: dem_lo shaded relief (40 m); dataset nac_hi (20 m); dem_hi shaded relief (20 m); DEM correction (target - bilinear) = dem_hi - bilinear_2x(dem_lo); predicted correction (model - bilinear) = pred - bilinear_2x(dem_lo) sharing vmin/vmax per-row with col 4 for direct comparison; NAC reflectance @ 0.5 m via reinterp_nac_raw_at_grid_gpu (native 1280 px -> downsampled to 640 px for display); model error (= predicted correction - ground-truth correction). Architecture re-uses v17low's v6 backbone (channels=(32,64,96), depths=(2,2,3,2,2), NAC-only in_channels=1, no-cond cond_dim=1; ~1.27 M params). The legacy mirror-flip lattice-shift workaround (np.roll) is now GATED on an actual lattice check and is skipped on the new datasets. trained 2200 steps (planned 10000; early-stop=True), best val RMSE = 0.8110 m at step 1600, ~1.27 M params, wall 26s, peak VRAM 798 MB; n_train=7312 / n_val=7334, lat-median split 19.9948 deg. median model RMSE 472 mm, bilinear baseline 507 mm, improvement 1.07x.
[30.7] nacdem_v20.2 training curve (v17low arch on rebuilt v18 dataset) updated 36d ago (2026-05-17 02:47)
Val RMSE (red) vs bilinear baseline (grey dashed) vs train Charbonnier (blue). trained 2200 steps (planned 10000; early-stop=True), best val RMSE = 0.8110 m at step 1600, ~1.27 M params, wall 26s, peak VRAM 798 MB; n_train=7312 / n_val=7334, lat-median split 19.9948 deg.
[29.1] v19.2 — Trained Mars Enhance weights (lat band -4..0) → lunar 3 pm tiles (best/median/worst val) updated 37d ago (2026-05-16 13:31)
Trained Mars Enhance weights (mars_model_enhance_-4, dim=32, 2*dim=64 px CTX-only single-channel input) applied to lunar 3 pm tiles. Bilinear-upsample stand-in for the Mars Interp branch (we don't have that checkpoint). Pure transfer baseline — no lunar training. NAC is per-tile p1/p99 stretched to [0,1] (lunar analogue of CTX /255) then bilinear-upsampled 32→64 to match the Mars input shape; the 64×64 residual output is bilinear-pooled back to 32×32 and added to the bilinear interp. Four un-norm recipes evaluated: truth (leaks dem_hi range), safe (±0.5·range(dem_lo)), fixed ±5 m, ls (global LS-fit scale — upper bound on face-value transfer). Card shows the ls recipe. Honest take: Mars residual output is in normalized [-1,+1] space tuned to Mars 4°-tile residual range (~hundreds of m); on the Moon at 640 m tiles the scales are wildly mismatched, and even with the best possible global scale the model gives ~0% improvement over plain bilinear. Compare vs v18 trained 1.93 m and v17low 0.314 m baselines. N=7882 3 pm tiles, TF inference wall 1.48 s (5339 tiles/s on PhysicalDevice(name='/physical_device:GPU:0', device_type='GPU')). median RMSE (LS-scale=0.758) 1.537 m, bilinear baseline 1.545 m, truth-leak un-norm 5.515 m, fixed ±5 m un-norm 4.929 m.
[29.2] v18a — Mars-exact MSE port WITH per-tile [0,1] normalization (best/worst/median val patches) updated 37d ago (2026-05-16 13:27)
Same V18 architecture and v18_dataset (15,782 xcorr-QC tiles, lat-median val split) as the v18 card above, but trained with the Mars-exact per-tile normalization v18 omitted: molaLims = (1.04·min−0.04·max, 1.04·max−0.04·min) on dem_lo (per Mars enhanceMain lines 488-492), clipped linear map to [0,1]; NAC is per-tile [0,1] min/max (Mars CTX is /255 clipped, but lunar I/F varies per terrain — we adapt to per-tile min/max). Both inputs and the dem_hi target live in [0,1]; loss is MSE in normalized space (Mars-exact). At val we un-normalize per tile via the same molaLims to report RMSE in metres. trained 50 epochs, best val RMSE = 2.9824 m at epoch 46, wall 161s, peak VRAM 2301 MB; n_train=7573 / n_val=7681, lat-median split 20.0370°. median model RMSE 1403 mm, bilinear baseline 1331 mm, improvement 0.95×.
[29.3] nacdem_v18a training curve (Mars per-tile [0,1] normalization) updated 37d ago (2026-05-16 13:24)
Left: train (blue) / val (red) MSE in Mars-normalized [0,1] space, log-y. Right: val RMSE in metres after un-normalizing per-tile. trained 50 epochs, best val RMSE = 2.9824 m at epoch 46, wall 161s, peak VRAM 2301 MB; n_train=7573 / n_val=7681, lat-median split 20.0370°.
[29.4] v18 — Mars-exact MSE port (best/worst/median val patches) updated 37d ago (2026-05-16 13:15)
Mars-exact PyTorch port of molaCTXEnhance/ctxEnhanceScript.py (arXiv:2101.04812): InterpModel (bilinear ×2 + 2× Conv2D 4×4 same, ~17 k params) + EnhanceModel (UNet 256/512/1024, ~23 M params) chained as dem_hi_pred = interp(dem_lo) + enhance([interp, nac_hi]). Trained on the v18_dataset.npz pack (15,782 xcorr-QC-accepted tiles) with vanilla Adam lr=1e-3 + pure MSE, no augmentation beyond the dataset's pre-baked E-W mirror, no FiLM, no cond. 6-column layout: shaded relief / NAC 10 m / NAC 5 m / NAC 0.5 m CPU / NAC 0.5 m GPU / model error. Cols 1-4 are live reinterp_nac_raw_at_grid(_gpu) calls from the raw NAC cube at the tile's stencil bbox; morning tiles (mirror_flip=True) are E-W flipped to match the packed cols 0/5. trained 50 epochs, best val RMSE = 2.6725 m at epoch 49, wall 146s, peak VRAM 2301 MB; n_train=7573 / n_val=7681, lat-median split 20.0370°. median model RMSE 1929 mm, bilinear baseline 1331 mm, improvement 0.69×.
[29.5] nacdem_v18 training curve (Mars-exact MSE) updated 37d ago (2026-05-16 03:57)
V18 train MSE (blue) vs val MSE (red), log-y. Pure MSE loss on the centred (per-tile-mean) absolute height target, matching the Mars generateEnhance training. trained 50 epochs, best val RMSE = 2.6725 m at epoch 49, wall 146s, peak VRAM 2301 MB; n_train=7573 / n_val=7681, lat-median split 20.0370°.
[29.6] nacdem_v17low best / median / worst val patches updated 38d ago (2026-05-16 00:18)
Same scoring rubric as v12, on the v17low sun_el bucket low (10-30) model (NO FiLM cond).
[29.7] v17low — best/worst/median validation patches (NAC alignment via corrections DB) updated 38d ago (2026-05-16 00:18)
Col 4 is the native-resolution NAC sampled directly from the calibrated cube via common/native_nac_crop.py, using the finest-GSD overlapping NAC per patch. The camera projection has the S07 pose_correction populated from the geolocated correction database (common/nac_corrections.py::fit_pose_correction), so col-4 represents the current best NAC alignment state (DB✓ on all rows). MEDIAN co-registers cleanly (~1.93 5 m cells); BEST/WORST currently regress under the rigid SE3 model and are being fixed by task #140 (dense flow-map alignment for all NACs). Regenerated from drivers/smoke/nacdem_v1_best_worst_median.py with --ckpt nacdem_v17low_train/best_nacdem_v17low.pt --corrections-db nac_corrections.parquet.
[28.1] nacdem_v1 — best / median / worst val patches updated 38d ago (2026-05-15 17:35)
Scored 1024 val patches by model-vs-truth RMSE on the central 28×28 window. Distribution: min 9 mm, median 82 mm, max 841 mm. The four BEST patches are flat mare-like terrain — bilinear-of-2:1-decimation is already exact, RMSE in the 1-cm range. The four WORST patches all contain visible craters / steep walls — exactly where 2:1 decimation throws away real topographic edges, and the model can't recover them from photometry alone (a single oblique NAC has no way to reconstruct sub-pixel rim curvature from one shading observation). The median lies an order of magnitude below the aggregate RMS (193 mm) — the average is dragged up by the cratered tail. Driver drivers/smoke/nacdem_v1_best_worst_median.py.
[26.1] v17 sun_el-bucketed models (low / med / high), NO sin/cos conditioning, canonicalize sun_az
Three independent v12-arch models (NAC-only, channels=(32,64,96), depths=(2,2,3,2,2), ~1.27 M params, 10k steps, wd=1e-3, warmup 200, patience 3), one per sun_el bucket. v17low = sun_el 10-30, v17med = 30-50, v17high = 50-70. All three drop FiLM sun conditioning (--no-cond: cond_dim=1 constant 1.0 vector); sun_az is canonicalised to morning-side so the trainer never sees afternoon-side photometry. Drivers: drivers/smoke/nac_local_train_chain_v17low.sh / _v17med.sh / _v17high.sh (orchestrator: _v17_all.sh). Chain phases: low=done, med=not-started, high=not-started.
[26.2] v17low NAC <-> NAC-DTM xcorr at 10 m posting (low (10-30)) updated 40d ago (2026-05-13 21:28)
Residual offset at 10 m posting. Median offset: (pending) (side JSON: nacdem_v17low_xcorr_registration.json).
[26.3] nacdem_v17low training curve - low (10-30) updated 40d ago (2026-05-13 21:27)
Training curve for v17low (sun_el bucket low (10-30), NO FiLM cond, v12 arch). Bilinear baseline at 10 m = 0.438 m; v12 best val = 0.298 m.
[26.4] v16 per-patch DEM range normalization (Mars-style); same v12 arch + regularization otherwise completed updated 40d ago (2026-05-13 17:32)
v16 per-patch DEM range normalization (Mars-style); same v12 arch + regularization otherwise. Target residual is divided by R = 1.08 * (z_truth.max - z_truth.min) per patch before Charbonnier loss on the full 32x32; model output multiplied by R for eval / inference. Per-patch R from the same truth tensor the target uses. Drivers: drivers/smoke/nac_local_train_chain_v16.sh. Chain status: done (2026-05-13T17:33:55-07:00).
[26.5] v16 NAC <-> NAC-DTM xcorr at 10 m posting updated 40d ago (2026-05-13 17:33)
Residual offset at 10 m posting. Median offset: (pending) (side JSON: nacdem_v16_xcorr_registration.json).
[26.6] nacdem_v16 best / median / worst val patches updated 40d ago (2026-05-13 17:32)
Same scoring rubric as v12, on the v16 target-normalized model.
[26.7] nacdem_v16 training curve - target-normalized updated 40d ago (2026-05-13 17:32)
Training curve for v16 (target-normalized; v12 arch). Loss is on the normalized scale; val RMSE is reported in physical metres. Bilinear baseline at this scale = 0.438 m; v12 best val = 0.298 m.
[26.8] nacdem_v15low best / median / worst + Lommel-Seeliger column updated 40d ago (2026-05-13 15:45)
4-col card: truth shaded relief, NAC reflectance (2-98 % stretched), model error, and an L-S render of the same NAC-DTM patch at this NAC's sun. The L-S column uses the SAME 2-98 % normalization as the NAC column so the visual compare is honest. v15low covers sun_el 10-30 deg (low-sun, strong shadows).
[26.9] nacdem_v12 best / median / worst + Lommel-Seeliger column updated 40d ago (2026-05-13 15:44)
4-col card: truth shaded relief, NAC reflectance (2-98 % stretched), model error, and an L-S render of the same NAC-DTM patch at this NAC's sun. The L-S column uses the SAME 2-98 % normalization as the NAC column so the side-by-side compare is honest. Per-patch (NAC mean, L-S mean, NAC-vs-L-S Pearson corr) printed under each L-S panel.
[26.10] v12 vs v13 per-patch residual correlation updated 40d ago (2026-05-13 13:02)
Pearson corr(pred residual, true residual) per val patch, n=512. Left = v12 (NAC + sun), right = v13 (zero-NAC control, identical arch / data). A right-shift of v12 vs v13 means the NAC channel is doing real photometric work. See drivers/smoke/nacdem_v12_vs_v13_residual_corr.py.
[26.11] v15 canonicalized + sun_el-bucketed (low / med / high)
Three v12-arch models on the canonicalised morning-side pool (every sun_az > 180 sample is L-R-flipped so trainer only sees sun_az in [0, 180]). Buckets split by --sun-el-min/--sun-el-max: v15low = sun_el 10-30, v15med = 30-50, v15high = 50-70. Compare each best val RMSE to v12's 0.298 m. Drivers: drivers/smoke/nac_local_train_chain_v15low.sh / _v15med.sh / _v15high.sh (orchestrator: _v15_all.sh). Chain phases: low=done, med=(not yet started), high=(not yet started).
[26.12] nacdem_v15low best / median / worst val patches (low (10-30)) updated 40d ago (2026-05-13 04:08)
Same rubric as v12, on the v15low (low (10-30) sun_el bucket) NAC subset.
[26.13] nacdem_v15low training curve - low (10-30) sun_el bucket updated 40d ago (2026-05-13 04:08)
Training curve for v15low (low (10-30) sun_el bucket; v12 architecture + canonicalised sun_az). Compare best val RMSE to v12's 0.298 m baseline.
Three independent trainings of the v12 architecture (NAC-only corrector + 1D sun cond, channels=(32,64,96), depths=(2,2,3,2,2), 10k steps, wd=1e-3, early-stop patience 3), each restricted to a time-of-day bucket via new --sun-az-min / --sun-az-max trainer flags. v14a = morning (sun_az 94-150), v14b = noon (150-210), v14c = afternoon (210-266). Hypothesis: a narrower sun-conditioning problem yields cleaner photometric signal than v12. Compare each bucket's best val RMSE to v12's 0.298 m. v14a runs in parallel with v13; v14b/v14c are sequential. Drivers: drivers/smoke/nac_local_train_chain_v14a.sh / _v14b.sh / _v14c.sh (orchestrator: _v14_all.sh). Chain phases: v14a=train_v14a, v14b=not-started, v14c=not-started.
[26.15] v13 NAC-zeroed control (1D sun only, same arch / data / regularization as v12) completed updated 40d ago (2026-05-13 02:44)
v13 NAC-zeroed control (1D sun only, same arch / data / regularization as v12). Trainer flag --zero-nac replaces the NAC patch with torch.zeros_like(nac) before every model forward (both train and eval); everything else (data, channels=(32,64,96), 10k steps, wd=1e-3, patience 3, --nac-only, --cond-1d) is identical to v12. If v13 val RMSE matches v12 (~0.30 m), the NAC channel was not contributing. Drivers: drivers/smoke/nac_local_train_chain_v13.sh. Chain status: done (2026-05-13T02:45:36-07:00).
[26.16] v13 NAC <-> NAC-DTM xcorr at 10 m posting updated 40d ago (2026-05-13 02:45)
Residual offset at 10 m posting. Median offset: (pending) (side JSON: nacdem_v13_xcorr_registration.json).
[26.17] nacdem_v13 best / median / worst val patches updated 40d ago (2026-05-13 02:44)
Same scoring rubric as v12, on the v13 NAC-zeroed control.
[26.18] nacdem_v13 training curve - NAC-zeroed control updated 40d ago (2026-05-13 02:44)
Training curve for v13 (NAC-zeroed control, otherwise identical to v12). Bilinear baseline at this scale = 0.438 m; v12 best val = 0.298 m.
[26.19] v12 predicted vs true residual - is the model actually using the NAC? updated 40d ago (2026-05-13 02:31)
Per-patch (best/median/worst) side-by-side: truth shaded relief, NAC reflectance, bilinear z_bil, TRUE residual (truth-z_bil), MODEL residual (v12 forward). If col 5 visually mirrors col 4 on crater patches, the network is doing real photometric work; if col 5 is diffuse noise, it isn't. Paired with v13 zero-NAC control.
[26.20] nacdem_v12 best / median / worst val patches updated 40d ago (2026-05-13 02:30)
Same scoring rubric as v11, on the v12 NAC-only corrector + 1D sun model.
[25.1] v12 NAC-only corrector + 1D sun (channels=(32,64,96), in_channels=1, cond_dim=2) completed updated 41d ago (2026-05-12 21:26)
v12 NAC-only corrector + 1D sun (channels=(32,64,96), in_channels=1, cond_dim=2). The bilinear z_bil interpolation is purely mechanical (added back outside the network as z_pred = z_bil + residual). Sun conditioning collapses to 2-D (cos(az-180), sin(az-180)); sun_el unused. Same v8 10 m bundle, v9 schedule (10k steps, warmup 200, wd=1e-3, early-stop patience 3). Drivers: drivers/smoke/nac_local_train_chain_v12.sh. Chain status: done (2026-05-12T21:27:18-07:00).
[25.2] nacdem_v12 training curve - NAC-only + 1D sun updated 41d ago (2026-05-12 21:26)
Training curve for v12 (NAC-only corrector + 1D sun, channels=(32,64,96), ~1.27 M params). Bilinear baseline at this scale = 0.438 m.
[25.3] v11 even-smaller model (~0.35 M params, channels=(16,32,64), depths=(1,2,2,2,1)) completed updated 41d ago (2026-05-12 20:23)
v11 even-smaller model (~0.35 M params, channels=(16,32,64), depths=(1,2,2,2,1)). Same v10 trainer/dataset/regularization (10k steps, warmup 200, weight_decay 1e-3, early-stop patience 3) on v8's 10 m posting bundle. Drivers: drivers/smoke/nac_local_train_chain_v11.sh. Chain status: done (2026-05-12T20:24:38-07:00).
[25.4] nacdem_v11 training curve - even-smaller model (~0.35 M params) updated 41d ago (2026-05-12 20:23)
Training curve for v11 (same v10 schedule and data, but ~0.35 M-param model instead of ~1.3 M). Bilinear baseline at this scale = 0.438 m.
[25.5] v10 small model (~1 M params, weight_decay 1e-3, 10k steps) completed updated 41d ago (2026-05-12 15:41)
v10 uses the same v9 schedule + regularization (10k steps, warmup 200, weight_decay 1e-3, early-stop patience 3) on v8's 10 m posting bundle, but shrinks the FiLM-RCAN-UNet from v9's 11.2 M params to ~1.3 M (channels=(32,64,96), depths=(2,2,3,2,2)). The user has used <2 M-param models on the equivalent Mars task with comparable results. Drivers: drivers/smoke/nac_local_train_chain_v10.sh. Chain status: done (2026-05-12T15:42:01-07:00).
[25.6] nacdem_v10 training curve - small model (~1 M params) updated 41d ago (2026-05-12 15:41)
Training curve for v10 (same v9 schedule and data, but ~1.3 M-param model instead of 11.2 M). Bilinear baseline at this scale = 0.438 m.
v9 reuses v8's 10 m posting bundle (truth, NACs, coverage cache) but trains with stronger AdamW weight decay (1e-3 vs v8's 1e-4), a shorter schedule (10k steps, warmup 200), and early stop after 3 consecutive val intervals without improvement. v8's best val was at step 2000 of 30000 — the rest was overfit. Drivers: drivers/smoke/nac_local_train_chain_v9.sh. Chain status: done (2026-05-12T13:38:55-07:00).
[25.8] nacdem_v9 training curve - regularized short-schedule updated 41d ago (2026-05-12 13:38)
Training curve for v9 (same trainer and data as v8, but with weight_decay=1e-3, 10k steps, early-stop patience 3). Bilinear baseline at this scale = 0.438 m.
[25.9] nacdem_v8 training curve - 20 m -> 10 m sanity updated 41d ago (2026-05-12 13:28)
Training curve for v8 (same trainer as v7, on 10 m posting block-mean of the v6 realigned 5 m inputs). At coarser scales the bilinear baseline misses more, so a working model should produce substantially lower val RMSE than v7 did at 5 m.
[25.10] v8 sanity test (20 m -> 10 m posting via block-mean of v6 realigned NACs) completed updated 41d ago (2026-05-12 13:28)
v8 sanity test. Same v7 model and per-patch GPU xcorr trainer, but truth and NACs are pre-block-meaned 2x (5 m -> 10 m, NaN-aware 2x2). The trainer's internal 2:1 decimation then implements 20 m -> 10 m; the per-patch xcorr block-means a further 2x so the FFT runs at 20 m (same physical scale as v7 ran at 10 m). Coverage cache built with --coarse 16 to match v7's --coarse 32 in metres. Drivers: drivers/smoke/build_v8_10m_dataset.py, drivers/smoke/nac_local_train_chain_v8.sh. Chain status: done (2026-05-12T10:47:45-07:00).
v7 per-patch GPU xcorr. On every training and val batch the loader hands the trainer 128×128 wide NAC + wide NAC-DTM windows centred on each 32×32 patch; a fully-batched torch routine (common/cuda_xcorr.py) block-means to 10 m, renders L-S(truth) at the per-patch sun, runs phase correlation with parabolic sub-pixel fit, and Fourier phase-shifts the 128×128 wide NAC at 5 m by (Δr, Δc); the central 32×32 is cropped and fed to the model. Patches with xcorr peak < 0.01 keep the unshifted NAC. Reuses v6's realigned NAC dir and coverage cache (phases 1-2 skipped). Chain status: done (2026-05-12T01:25:07-07:00). Drivers: steps/S18_pix2pix_dem/impl/train_nacdem_v7.py, drivers/smoke/nac_local_train_chain_v7.sh.
[25.12] v7 NAC ↔ NAC-DTM xcorr after per-patch realign updated 42d ago (2026-05-12 01:25)
Residual offset after per-patch xcorr. Median offset: (pending) (side JSON: nacdem_v7_xcorr_registration.json).
[25.13] v7 registration check (3 median patches, wide context) updated 42d ago (2026-05-12 01:24)
3-panel comparison (shaded relief / NAC reflectance / L-S render of NAC-DTM) over a 300×300 window; if per-patch xcorr is working, residual local fringing visible in v6 col 4 should be eliminated.
[25.14] nacdem_v7 best / median / worst val patches updated 42d ago (2026-05-12 01:23)
Same scoring rubric as v6, on the per-patch xcorr-realigned dataset.
[25.15] nacdem_v7 training curve — per-patch GPU xcorr realigned NACs updated 42d ago (2026-05-12 01:22)
Training curve for nacdem_v7 (same model config as v6, per-patch GPU xcorr applied at dataloader time on top of v6's realigned NACs).
Identical to v5 (8×8 per-NAC local-xcorr probe grid → MAD-inlier-filtered IDW shift map at bbox size → CUDA interp_lookup resample with small per-NAC TIFs carrying NDT_R_OFFSET / NDT_C_OFFSET tags), but with the FR_bbox / FC_bbox sign flipped in nac_local_resample.py to honour L-S(r, c) ≈ NAC(r − Δr, c − Δc) — the v5 resample applied the inverse shift. Chain status: done (2026-05-11T22:29:01-07:00). Realign progress: 270/270 NACs kept so far. Drivers: drivers/smoke/nac_local_resample.py, drivers/smoke/nac_local_train_chain_v6.sh.
[24.2] v3 pipeline — local xcorr realignment + retrain
current phase: done — v6 chain complete (ts=2026-05-11T22:29:01-07:00)
phase
progress
notes
1. 8×8 local xcorr + CUDA resample
270/270 (100.0%)
kept=270 fallback=0 low_cov=0; 1467s
8×8 grid of 64×64 @10 m FFT phase-corr xcorr probes per NAC (equivalent to 128×128 @ 5 m). Bilinearly-interpolated per-cell shift built into a CUDA lookup-table resample. Chain log: /home/chandmer/nvme-8tb-2/DEMEnhancement/outputs/s18_apollo17/nac_local_train_chain.log. Drivers: drivers/smoke/nac_local_resample.py, drivers/smoke/nac_local_train_chain.sh.
[24.3] v6 NAC ↔ NAC-DTM xcorr after sign-corrected local realign updated 42d ago (2026-05-11 22:29)
Residual offset after sign-corrected local realign. Median offset: (pending) (side JSON: nacdem_v6_xcorr_registration.json). Expectation: post-sign-flip residuals should be much closer to zero than v5's (−0.00, +2.20) px.
[24.4] v6 registration check (3 median patches, wide context) updated 42d ago (2026-05-11 22:28)
3-panel comparison (shaded relief / NAC reflectance / L-S render of NAC-DTM) over a 300×300 window; if sign-corrected local realign is working, all three columns should align identically.
[24.5] nacdem_v6 best / median / worst val patches updated 42d ago (2026-05-11 22:26)
Same scoring rubric as earlier versions, on the sign-corrected locally-realigned dataset.
[24.6] nacdem_v6 training curve — sign-corrected local-xcorr realigned NACs updated 42d ago (2026-05-11 22:26)
Training curve for nacdem_v6 (same model config as v5, dataset rebuilt against the sign-corrected local-xcorr realigned NACs).
[24.7] v5 registration check (3 median patches, wide context) updated 42d ago (2026-05-11 21:33)
3-panel comparison (shaded relief / NAC reflectance / L-S render of NAC-DTM) over a 300×300 window; if local-xcorr realignment is working, all three columns should show identical crater positions.
[24.8] v5 NAC ↔ NAC-DTM xcorr after small-TIF local realign updated 42d ago (2026-05-11 19:48)
Residual offset after local realign: median (Δr, Δc) = (−0.00, +2.20) px ≈ (0, +11 m); weighted mean (−0.71, +1.39) px. v1 baseline was (−1, +5) px ≈ (−5, +26 m). Local xcorr eliminated almost all of the per-NAC pointing residual.
[24.9] nacdem_v5 best / median / worst val patches updated 42d ago (2026-05-11 19:46)
Same scoring rubric as earlier versions, on the locally-realigned dataset. Distribution: min 10 mm, median 82 mm, max 857 mm.
8×8 per-NAC local-xcorr probe grid (64×64 @ 10 m windowed reads of the bbox + 64-cell margin) → MAD-inlier-filtered per-NAC IDW shift map, computed at bbox size → CUDA interp_lookup resample. Each NAC written as a small TIF carrying NDT_R_OFFSET / NDT_C_OFFSET tags; dataset reads NDT pixel (r, c) by subtracting per-NAC offset. Result: 270/270 NACs kept (criterion: at least 1 fully-covered 32×32 patch). Phase 1 ran in 446 s (vs ~4800 s for v2). Storage 14 GB vs 124 GB for the full-canvas approach. Drivers: drivers/smoke/nac_local_resample.py, drivers/smoke/nac_local_train_chain_v4.sh. Chain status: done (2026-05-11T22:29:01-07:00).
[24.11] nacdem_v5 training curve — local-xcorr realigned NACs updated 42d ago (2026-05-11 19:45)
Best val RMSE 0.192 m at step 5000 (v1 raw NACs: 0.193 m; pure bilinear baseline 0.206 m → v5 gain ×1.08, marginal but real). The TOD breakdown is now balanced across morning / noon / afternoon (was afternoon-only when v3 only had 42 NACs).
[24.12] v3 NAC ↔ NAC-DTM xcorr after local realignment updated 42d ago (2026-05-11 13:50)
Residual misalignment after the v3 realignment. Median (Δr, Δc) should collapse to (0, 0) if the local xcorr captured all of it.
[24.13] nacdem_v3 best / median / worst val patches updated 42d ago (2026-05-11 13:50)
Same scoring rubric as v1 / v2 cards, on the locally-realigned dataset.
[24.14] nacdem_v3 training curve (locally-realigned NACs) updated 42d ago (2026-05-11 13:49)
v3 trains on NACs realigned via per-cell local xcorr (8×8 probe grid, bilinear-interpolated). Compare best val to v1 (0.193 m) and the 0.206 m bilinear baseline.
Same 64×64 xcorr sweep as the v1 card but on the realigned NACs. Median (Δr, Δc) should now collapse close to (0, 0) if the per-NAC affine fit is working — otherwise the residual identifies what is still misaligned.
[24.17] nacdem_v2 best / median / worst val patches updated 43d ago (2026-05-11 01:51)
Same scoring rubric as v1 card, on the realigned dataset. Compare RMSE distribution and per-patch residual structure against v1 to judge how much of the remaining error was registration-driven.
[24.18] nacdem_v2 training curve (realigned NACs) updated 43d ago (2026-05-11 01:51)
v2 trains on the per-NAC affine-realigned NACs (median ~26 m east shift + per-NAC variation corrected) against the same NAC-DTM truth and identical hyperparameters to v1, so any val-RMSE improvement is directly attributable to fixing the registration error.
median (Δr, Δc) = (-1.06, +5.24) px = (-5, +26) m; weighted mean = (-1.27, +4.50) px (300 patches scored). For each val-region patch with ≥3 m relief in a 64×64 window centered on the model patch, FFT cross-correlate the NAC reflectance against the Lommel-Seeliger render of the NAC-DTM at the same sun; sub-pixel peak via parabolic fit. Top-left scatter of (Δc, Δr) shifts colored by peak correlation; red × marks the median. Top-right histograms of Δr (south) and Δc (east). Bottom row spatial maps of Δr and Δc by patch location — looks for AOI-scale gradients (none obvious here, suggesting global east shift plus per-NAC random scatter). Driver drivers/smoke/nacdem_v1_xcorr_registration.py.
[23.2] nacdem_v1 registration check — wide context around 3 median-RMSE patches updated 43d ago (2026-05-10 23:25)
Three median-RMSE val patches shown in a 300×300 (1.5 km square) context window from both the NAC-DTM (shaded relief, lit by this NAC's sun) and the NAC reflectance (same wide window, 2–98 % per-window percentile stretch for visibility). The faint red box marks the 32×32 model patch the trainer scored. Identical crater / slope features should land on the same pixels across the two columns; any persistent N-pixel offset is direct evidence of NAC ↔ NAC-DTM mis-registration. Driver drivers/smoke/nacdem_v1_registration_check.py.
[23.3] nacdem_v0 vs v1 — fixing the NAC channel changed nothing updated 43d ago (2026-05-10 22:38)
Same model, hyperparameters, data, and seed. Only the NAC validity/normalization changed. v0 trained on essentially blank NAC inputs (FLT_MIN sentinel masquerading as valid). v1 sees real pass-through I/F reflectance. Both converge to val RMSE ≈ 0.193 m at step 4000 and overfit identically afterward (Δ best = −0.7 mm). Pure bilinear baseline is 0.206 m, so both runs improve it by ×1.07. The TOD-split panel shows the model IS using the NAC channel in v1 (noon becomes the *worst* TOD because overhead light has the least shape contrast, whereas v0 had noon as *best* by relying on FiLM sun-elevation alone) — but the prediction target itself has no recoverable structure at this scale. The 10 → 5 m residual budget is exhausted by DTM noise; no photometric channel can help. Next move must change the prediction task, not the model.
12 random 32×32 patches from the val region (south half of NAC-DTM bbox) with non-trivial relief and ≥80 % NAC coverage. Left: shaded relief of NAC-DTM truth, lit by this NAC's own sun_az/sun_el. Middle: the NAC reflectance reprojected onto the same 32×32 grid points (this is exactly what the model sees as conditioning). Right: bilinear residual (truth − bilinear(2:1-decimate)) — what the model is asked to predict. If registration were good, bright NAC slopes should fall on the same pixels as shaded-relief slopes and as the diverging features in the residual. Bug found: the trainer's NAC validity check was arr != 0.0 — but cam2map writes float32 nodata as ~-3.4e38, not 0. 83 % of typical NAC pixels were sentinels masquerading as valid; per-patch percentile stretch then collapsed real reflectance to 0 or 1. The nacdem_v0 training run saw effectively blank NAC inputs, which is why val RMSE barely beat the bilinear baseline — the model never had photometric signal. Fixed in steps/S18_pix2pix_dem/impl/dataset_nacdem.py (NaN-out the sentinel before percentile / coverage tests). Retrain pending. Driver drivers/smoke/nacdem_v0_patch_inspect.py.
[23.5] NAC-DTM high-frequency budget @ 5 m posting updated 43d ago (2026-05-10 16:36)
Sampled 400 random 32x32 patches. Per-patch relief = 9.0 m RMS; bilinear residual = 0.24 m RMS (2.6 % of relief). I.e. decimating the NAC-DTM 2:1 to 10 m and bilinear-upsampling back recovers 97 % of the patch already. The LROC NAC stereo pipeline posts at 5 m but its effective resolution is closer to 10-20 m — the PSD rolls off well before the 10 m Nyquist annulus. That is why nacdem_v0 ≈ bilinear baseline: there is almost no signal in the 10 → 5 m band for any model to learn. To get a useful super-res model, train at a coarser scale (e.g. 40 → 20 m) where the residual is a meaningful fraction of relief. Driver drivers/smoke/nacdem_entropy_check.py.
[23.6] nacdem_v0 training curve updated 43d ago (2026-05-10 16:36)
30 000 steps in 36 min on the 270 5 m NAC stencils + NAC-DTM ground truth. Best val RMSE 0.192 m at step 4 000; subsequent training overfit (val drifted to 0.211 m by step 30 k while train loss fell from 0.107 → 0.076). The grey dotted line marks the pure-bilinear baseline (residual ≡ 0) at 0.206 m on the same val sampler — the model only improves bilinear by ×1.07 (Δ ≈ 13 mm). See the entropy panel below for why. Driver drivers/smoke/nacdem_v0_train_curve_card.py.
[23.7] Training AOI for the new model — NAC-DTM footprint + NAC overlay density updated 43d ago (2026-05-10 12:39)
The next model will be supervised on the 17.5 % of the AOI where we have 5 m Apollo 17 NAC stereo ground truth — a 47.9 x 57.8 km box at 19.4-21.3 N x 29.9-31.6 E. Left: shaded relief of the NAC-DTM region (black = stereo-failed cells inside the bbox). Right: per-cell NAC image overlay density inside the footprint — every cell is imaged by 4-57 aligned NACs, median 13. That multi-illumination depth is what makes photometric closure / sun-aware super-resolution actually identifiable here. Driver drivers/smoke/nacdem_training_area_card.py.
Three-panel: scatter, residual histogram, spatial residual map. Across 6.04 M overlap cells (17.5% of AOI), median = +0.23 m, RMS = 25.8 m, 5-95 percentile −35..+38 m. After the 2026-05-10 ×2 unit fix the two datasets have essentially zero bias; the RMS is honest disagreement, dominated by slope-induced mismatch on Taurus-Littrow massif walls (LDEM at 20 m posting can't resolve sub-cell relief that NAC-DTM at 5 m can). Driver drivers/smoke/ldem_nac_diff_chart.py.
Sweep ±300 m of horizontal shifts in 20 m steps, then parabolic sub-pixel refinement around the integer minimum. Best alignment: Kaguya needs to move (-15.3 m E, -12.2 m N) — i.e. NW by ~20 m. RMS residual 5.04 → 4.52 m (10% reduction). Direction matches the NW-SE residual stripe pattern in the previous agreement card and is consistent with the LRO orbit-track direction (sub-pixel SOCET-vs-USGS-ASP geo-reg mismatch). Driver drivers/smoke/dem_xcorr_align.py.
[23.10] DEM local-entropy + LOLA agreement updated 43d ago (2026-05-10 09:08)
Per-cell |z − mean(4-neighbours)|. Bright = real high-frequency detail; dark = smooth / interpolated (biharmonic-like). Median entropy: LDEM = 0.01 m (essentially smooth), NAC-DTM = 0.23 m (10× richer), Kaguya = 0.03 m (median smooth — mare-dominated AOI — but p99 = 0.3 m vs LDEM 0.3 m, real detail at tile boundaries / crater rims).
Pairwise agreement at overlap cells. LOLA − NAC-DTM (899,644 cells): median -0.2 m, RMS 7.4 m. LOLA − Kaguya (4,246,490 cells): median -0.3 m, RMS 7.3 m. NAC-DTM − Kaguya (5,628,224 cells): median +0.0 m, RMS 5.0 m. The triangle of medians is consistent: LOLA and Kaguya agree (±16 m bias); NAC-DTM is systematically ~130 m too low relative to both. The bias is the imperfect single-global-offset in build_truth_v9.py (it averaged over biharmonic-infill cells dominating, not real LOLA shots). Worth refitting per-tile or per-shot-cluster.
[23.11] DEM coverage panel — RGB overlay + per-dataset relief updated 43d ago (2026-05-10 09:06)
Four-panel inventory of every "real" DEM we have over the AOI. Panel 1: RGB-tinted coverage map over the AOI shaded-relief base — R = LOLA real shots (13.6%), G = Apollo 17 NAC stereo DTM (17.5%), B = Kaguya TC mosaic (76.5%). Channel mixes show overlap (cyan = NAC+Kaguya, magenta = LOLA+Kaguya, yellow = LOLA+NAC, white = all three). Panels 2-4: shaded relief computed only from each dataset where it has real data — black wherever the dataset is silent. Lets you eyeball the actual spatial distribution of each source. Driver drivers/smoke/dem_coverage_panel.py; sources ldem.npz, ldem_holdout_f50.npz, truth_v9.npz, aux_dems/kaguya_tc_mosaic_aoi.npz.
Per-pixel mean reflectance over all NACs in each sun-azimuth bucket, plotted side-by-side with the RGB-by-TOD coverage overlay. Composites are not radiometrically or geometrically co-registered beyond the AOI alignment — they are intentionally a slightly blurred collage that shows what the AOI typically looks like at each time of the lunar day. Note the consistent illumination direction within each panel (morning shadows long to the west, afternoon to the east). Driver drivers/smoke/nac_tod_collage.py; source nacs_full_packed/.
RGB overlay over the Apollo 17 AOI (18-22 N x 29-33 E) showing where each cell has been imaged at different times of the lunar day. Channels are driven by NAC sun azimuth (horizon frame, 0=N, 90=E, 180=S, 270=W): R = morning (sun_az 60-150, rising in the east; 356 NACs), G = noon (sun_az 150-210, near the south meridian; 81 NACs), B = afternoon (sun_az 210-300, setting in the west; 374 NACs). White cells have coverage from all three bands; saturated reds/greens/blues mark regions imaged only at one time. Any NAC coverage: 99.8% of AOI. All 3 TOD bands: 48.2%. Source: nacs_full_packed/ (821 NACs); driver drivers/smoke/nac_tod_rgb_overlay.py.
[22.3] v6 fractal-scale cascade — 8 PPD base → 128 PPD updated 44d ago (2026-05-09 14:05)
Mars-style fractal-scale cascade: best_v6.pt (curated, no-biharmonic-slop) applied at every PPD doubling 8→16→32→64→128. Centered inputs/outputs are scaled by (output_posting / 20 m) per fractal H=1 to bring v6 into its training distribution. NAC-less cells fall back to bicubic-of-8-PPD (no peeking at finer LDEM). Total AOI RMSE: v6 = 116.74 m vs bicubic-only = 116.21 m (essentially tied because ~76 % of cells fall back). Where v6 actually ran (508,415 cells, 23.6% of AOI): v6 = 42.55 m vs bicubic = 82.26 m (48% better). The cascade works where NAC photometry exists; gain across the full AOI requires broader NAC coverage.
[22.4] PPD-cascade test — gap-free 8 PPD up to 128 PPD updated 44d ago (2026-05-09 09:01)
Native 512 PPD LDEM block-mean-decimated to 8 PPD (~3.8 km posting; 97.2% gap-free at 18-22°N) → 4× successive bicubic 2x upsample → compared to actual 128 PPD LDEM (block-mean from 512 by 4×). Bicubic-cascade RMSE = 116.21 m vs. single-step bilinear 123.07 m, on relief of 8122 m. The error is dominated by the AOI-wide lat-lon slope across 4° × 4°; high-frequency detail loss from 64× decimation is a much smaller fraction. We do NOT have a model trained for pure DEM super-resolution; v8 (current champion) only operates at 20 m posting using NAC photometry. This card establishes the bicubic-only baseline; any future super-res model would need to beat it.
[21.1] v9_0 vs NAC-DTM truth at Apollo 17 LM site updated 45d ago (2026-05-08 17:44)
20 km × 20 km window at Apollo 17 LM (94% covered by Apollo 17 stereo NAC DTM in truth_v9.npz). 4 panels: LDEM (smooth supervision), v8_6 (best v8, never saw NAC-DTM), v9_0 (warm-started from v8_6, fine-tuned 4k steps with NAC-DTM truth in this footprint), NAC-DTM (the actual high-frequency surface). Discontinuity scores in window: LDEM 0.051, v8_6 0.077, v9_0 0.085 (+11% over v8_6, moving toward natural), NAC-DTM 0.882. v9_0 is heading the right direction but still 10× smoother than reality — Charbonnier loss + biharmonic prior architecture biases output toward smooth mean. Larger jumps would require either GAN-style detail generation or much larger NAC-DTM coverage to dominate training.
[21.2] LDEM vs Apollo 17 stereo-NAC DTM — the supervision target was lying updated 45d ago (2026-05-08 15:00)
Three views of the SAME 10 km × 10 km of Apollo 17 / Taurus-Littrow valley. Left: the LDEM we've been training against (20 m posting, LOLA-only interpolation). Middle: the stereo-NAC DTM block-meaned to 20 m. Right: the NAC DTM at native 5 m. The LDEM is dramatically smoother than reality at the same posting — its discontinuity score is 0.047 versus 0.334 for the real surface (7× less). axis_alignment 0.641 vs 0.785 (LDEM less anisotropic because real ridges have direction; smoothing erases it). Implication for v8 training: the model can't look like real terrain because its supervision target is itself smoothed. v9 design pivot: train against NAC DTM where it overlaps the AOI (29.91°-31.66° E, 19.39°-21.30° N — SW quadrant, ~58 km × 53 km, ~12% of AOI area). Source: NAC_DTM_APOLLO17.TIF from LROC PDS, 463 MB, cached at nac_dtm_apollo17.npz.
[21.3] v7 full-AOI enhanced LDEM, ALL aligned NACs (~512 ppd) updated 45d ago (2026-05-08 06:36)
Full 4° AOI v7 inference using all 604 aligned NAC tifs in outputs/s18_apollo17/nac_aligned/ (streamed from disk in two passes — 84 GB doesn't fit in RAM). Pass 1: per-NAC patch coverage SAT (~9 min). Pass 2: top-8 NACs per patch contribute Hann × per-cell-NAC-validity predictions (~9 min). 130,207 of 132,728 patches recruited (98%, vs 16% with the 80-NAC v3_packed dataset); 578 of 604 NACs contribute. Per-cell coverage: 60.6% of native cells have v7 corrections (vs 14% before). Cached at v7_full_aoi_allnacs.npz (63 MB compressed). Sun NW (top-left) for both relief panes.
[20.1] v7 full-AOI enhanced LDEM vs existing biharmonic (~512 ppd) updated 46d ago (2026-05-07 23:36)
v7 multi-NAC inference run over the entire 4° × 4° AOI (6065 × 5699 cells at native 20 m posting → 2021 × 1899 ≈ 505 ppd display via 3× block-mean). Each cell is the photometric consensus across the top-8 overlapping NACs (min 30% coverage, weighted by Hann × per-cell-NAC-validity). Cells with no NAC contribution fall back to biharmonic. Left: existing biharmonic LDEM (LOLA-shot interpolation only). Middle: v7 enhanced. Right: signed Δz (v7 − biharmonic), ±p99 |Δ|, with biharmonic relief faded underneath as context. Full-resolution v7 DEM cached at outputs/s18_apollo17/v7_full_aoi.npz (117 MB, includes per-cell coverage count). 14% of native cells have v7 coverage; the rest are biharmonic.
[20.2] v7 multi-NAC inference (production-mode) — 4 sample windows updated 46d ago (2026-05-07 22:45)
Same v7 model as the previous card, but at inference each patch is processed by every NAC with ≥30% valid coverage (capped at top-8 by coverage to bound compute on areas with hundreds of overlapping NACs). Each NAC's prediction contributes Hann × per-cell-NAC-validity weight, so the per-cell output is a photometric consensus across all overlapping NACs that look at this patch — different sun azimuths and elevations give the model diverse photometric views of the same surface, and the shape that's consistent with all of them is what gets reinforced. Apollo 17 AOI has 5.2 NACs per recruited patch on average; mean per-cell coverage = 10.6 contributions (vs single-NAC's 2.0). 5-pane layout matches the v7 single-NAC card; pane 3 still shows the best-coverage reference NAC for the window. Coverage is limited by where ANY NAC has valid pixels, not by how many — cells with no NAC fall back to biharmonic.
[20.3] v7 biharmonic-prior + photometric closure — 4 sample windows updated 46d ago (2026-05-07 22:22)
v7 = same FiLMRCANUNetV6 body (72.86 M params), but channel 0 is the biharmonic LDEM (per-patch centred) instead of train-anchor heights, and the model predicts a residual Δz on top: z_pred = z_biharmonic + model(...). Loss adds L_photo: differentiable Lommel-Seeliger render of z_pred under the patch sun, normalised and compared via Charbonnier to observed NAC. Held-out RMSE by inner gap: 5–10 px 0.223 m, 10–20 px 0.338 m, 20–40 px 1.928 m (vs v6 50 m), 40–60 px 2.324 m (vs v6 70 m). Eliminates v6's large-gap collapse while staying best-in-class with v6 at small gaps. Aggregate bracketed 2.16 m, ~v5 (2.10 m). Inference Hann-blend is now masked per-cell by NAC validity, so cells with no photometric input fall back to biharmonic instead of getting OOD-input predictions (training requires 100% NAC valid in patch but eval admits 50%+; previously zero-NAC cells inside admissible patches got garbage predictions). 5-pane layout: existing biharmonic LDEM | v7 NAC infill | reference NAC reflectance for the window (best-coverage NAC; sun az/el in title) | v7 − LOLA truth at held tracks | biharmonic − LOLA truth at held tracks (apples-to-apples baseline; same vmax as pane 4 so v7's improvement is visible directly; pane 5 also reports the RMSE-reduction multiplier in the title). Note: warm-started from best_v6.pt; training NaN'd at step 28k of 80k (AMP+photometric numerical instability), so this is from the EMA snapshot at step 28k.
[20.4] v6+v5 per-cell ensemble — 4 sample windows updated 46d ago (2026-05-07 10:03)
For each held cell on the native 20 m grid: use v6 prediction if max(d_east, d_west) ≤ 20 px (tight bracket), otherwise v5. Combines v6's small-gap precision with v5's long-gap robustness. Held-out RMSE by inner gap: 5–10 px 0.35 m, 10–20 px 0.26 m (matches v6 alone, 2.6× better than v5 alone), 20–40 px 1.27 m (close to v5 alone 0.98 m, recovers from v6 alone's 49.79 m), 40–60 px 2.91 m. Aggregate bracketed RMSE 2.65 m. Routing: only ~5% of held cells fall into v6-territory because most held-cell brackets are wider than 20 px (cross-corridor). Cells routed to v6 are tinted blue in the middle pane.
[20.5] v6 decimate→infer→upsample (K=4, 80 m posting) updated 46d ago (2026-05-07 09:53)
Block-mean LDEM + NAC by 4× → 80 m posting; feed v6 with FiLM posting_in_log2 = 2.0; bilinear-upsample prediction back to 20 m. Idea: a 60 px bracket at native 20 m becomes a 15 px bracket at 80 m, inside v6's small-gap sweet spot. Result: doesn't work. v6 was trained at single scale (posting_in_log2 always 0); pil=2 is out-of-distribution and the model produces near-random output. Bracketed 5–10 px (native): 20 m RMSE; bracketed 20–40 px: 83 m; aggregate bracketed: 90 m. Compare to v5 (multi-scale trained): 0.32 / 0.98 / 2.10 m. Conclusion: multi-scale inference needs multi-scale training; v6 needs to be retrained with posting aug, or v5+v6 ensemble (above) is the right path.
[20.6] v6 deeper anisotropic + bracket-aware — 4 sample windows updated 46d ago (2026-05-07 09:43)
v6 = 72.86 M-param FiLM-RCAN-UNet at 64×64 patches (1.28 km × 1.28 km @ 20 m), 5-channel input including d_east/d_west bracket cues, parabolic loss weighting, Hann-blended overlap (stride 16). v6 is best-in-class at short bracket gaps (≤20 px = 400 m): bracketed RMSE 0.176 m at 5-10 px and 0.262 m at 10-20 px — roughly 2× better than v5. Falls apart for gaps > 20 px (50-70 m RMSE) due to training-distribution bias of BracketedPatchDataset. Useful as a small-gap specialist; v5 remains the AOI-wide production model.
[20.7] S18 training progress — v6 updated 46d ago (2026-05-07 07:28)
v6 (64x64 bracket-aware infill: 5-ch input, anisotropic deeper net) · step 80000/80000 · 585.9 min elapsed · 2.3 steps/s · ETA 0 min · best val_rmse = 0.672 m (latest live=0.664 m, EMA=0.672 m) · 72.9 M params
[19.1] v5 multi-scale + Hann-blended — 4 sample windows updated 47d ago (2026-05-06 20:57)
v5 = v4 architecture + multi-scale K∈{1,2,4} training aug + Hann-blended overlap (stride 8, 32×32 Hann window). Patch-edge blockiness in the Δ heatmap should be eliminated relative to v4. Held-out LOLA cell RMSE: 3.316 m overall (worse than v4 0.995 m). Multi-scale aug hurts mid-gap predictions despite improving close-to-track ones: v5 wins at 1-10 px gap (0.47 vs 0.67 m) but loses at 10-30 px gap (4.24 vs 1.21 m). Useful as a reference; v4 remains the production cross-track-infill model.
[19.2] v4 cross-track NAC infill — 4 sample windows updated 47d ago (2026-05-06 20:55)
Each row = one sub-AOI at 20 m posting (10×10 km). Left: existing biharmonic-fill LDEM. Middle: v4 cross-track NAC infill (uncovered cells fall back to biharmonic). Right: signed Δ heatmap (v4 − biharmonic), ±p99 |Δ|. Both relief panes have LOLA train-shot cells in cyan and held-out-track shot cells in magenta — the corridor stripes the biharmonic fill is extrapolating between. Where v4 is covered, RMSE on held-out LOLA truth = 0.995 m (vs 6.46 m biharmonic baseline).
74 discrete LOLA-track corridors detected. f=0.10: train=67 held=7 RMSE=6.21m p95=12.1m | f=0.25: train=56 held=18 RMSE=6.27m p95=11.5m | f=0.50: train=37 held=37 RMSE=6.46m p95=12.0m | f=0.75: train=18 held=56 RMSE=6.32m p95=12.0m. Biharmonic RMSE on held-out LOLA truth is ~6 m across every holdout fraction — far above LOLA's 0.1 m precision. LOLA tracks carry real cross-track information that biharmonic alone cannot recover; NAC photoclinometric infill has ~6 m of room to add value.
Damped Jacobi (ω = 0.60) on the 5×5 ∇⁴ stencil, 8000 iters in 16.0 s. Final |∇⁴φ|_max = 0.0054 m (was 1.074 m before iteration). Mean |Δ| from original = 0.66 m, p99 = 2.18 m, 51.7% of cells moved by ≥ 0.5 m. Pinned shot cells unchanged.
[18.3] Apollo 17 SE site (19.73 N 31.09 E) -- DEM enhancement vs decimation depth updated 49d ago (2026-05-05 00:53)
Same routine as the LM card, AOI centred at 19.7298 N / 31.0931 E (south-east of the LM, much higher relief). s=20m: RMSE=0.00m p95|Δ|=0.00m | s=40m: RMSE=0.61m p95|Δ|=1.52m | s=80m: RMSE=1.59m p95|Δ|=3.56m | s=160m: RMSE=4.19m p95|Δ|=8.66m | s=320m: RMSE=9.99m p95|Δ|=20.38m. sigma-across-5: median=2.44m p95=8.20m.
[18.4] Apollo 17 LM site -- DEM enhancement vs decimation depth updated 49d ago (2026-05-05 00:50)
Block-mean decimate the 20 m LDEM (and AOI NAC strips) to starting posting s in {20,40,80,160,320} m, then recursively re-enhance back to 10 m via the v2 model (3-bucket sun-azimuth consensus per pass). All 5 final DEMs are cropped to the same 1040 x 1068 LM AOI. Δ is computed vs the s=20m reconstruction; the 5-DEM per-pixel std measures cross-scale stability. s=20m: RMSE=0.00m p95|Δ|=0.00m | s=40m: RMSE=0.31m p95|Δ|=0.61m | s=80m: RMSE=1.55m p95|Δ|=3.12m | s=160m: RMSE=4.48m p95|Δ|=9.88m | s=320m: RMSE=8.14m p95|Δ|=17.72m. sigma-across-5: median=1.74m p95=7.53m.
[18.5] Apollo 17 LM site -- 3-pile DEM enhancement (10 m) updated 49d ago (2026-05-05 00:39)
Pile sizes: A=201, B=201, C=202 NACs (seed=17, disjoint random partition). Per-pixel sigma(A,B,C): median = nan mm, p95 = nan mm. All four panels share the same 10 km x 10 km AOI at 10 m posting (1000 x 1000 px). Terrain colormap shares vmin/vmax across A/B/C; sigma uses magma 0..3x median sigma.
~47 distinct ground-track corridors visible in the column-projection (mean inter-corridor spacing 2.30 km, median 1.64 km, range 0.22–8.02 km). Per-row centroid analysis sees ~135 tracks per row with median 630 m / mean 840 m spacing — the difference is sparse shots between well-defined corridors. ~25 % of spacings are < 350 m, ~5 % > 2.2 km.
Left: LDEM elevation. Right: log10|L4| where L4 = z − 0.25·(N+S+E+W). Cells satisfying the Laplacian to ≪ LOLA shot noise (≈0.1 m) are pure analytic fill between LOLA ground tracks. ~13.7% of cells have |L4| ≥ 0.1 m (real shot information, the visible N–S stripes); the remaining ~86% is interpolated low-entropy fill. Median |L4| = 0.020 m.
[15.1] NAC coverage count over AOI (6000×6000, 4°×4°) updated 51d ago (2026-05-02 19:54)
Each pixel = number of NAC images whose 4-corner ground footprint covers it. Built from per-cube geom.parquet via 4 ray-traces per cube + polygon rasterise. Re-run with python -m drivers.smoke.nac_coverage_count.
NAC coverage on graticule (legacy Malapert-era) updated 50d ago (2026-05-03 13:28) — click to expand · images load on open
NAC coverage on graticule + sun-geometry distribution
NAC camera-pointing & timing corrections updated 50d ago (2026-05-03 13:28) — click to expand · images load on open
4-panel diagnostic (Δaz/Δel scatter · Δt histogram · CC peak histogram · corrections vs sun-az)
Last v2 training run: step 89838/100000 · 30.0 min elapsed · last train loss = 0.00162 · best val = 0.52008 · model 24.0 M params @ base_ch=96
DEM-product quality comparison updated 51d ago (2026-05-02 14:06) — click to expand · images load on open
DEM-product quality comparison (per-pixel local autocorrelation)
AOI: lon 29-33 deg E, lat 18-22 deg N (centre 20 N, 31 E). Per-pixel local lag-1 autocorrelation rho in a 9x9 window. Real terrain has rho ~ 0.95+; interpolation fill / data-gap noise has rho ~ 0.0-0.5. NaN cells (data gaps) are white.
per-product summary table + interpretation
# DEM-product quality comparison — Apollo 17 AOI

AOI: lon 29..33 deg E, lat 18..22 deg N (centre 20 N, 31 E).

Per-pixel **local lag-1 autocorrelation** in a 9x9 window. Real terrain has rho near 0.95+ (smooth, autocorrelated). Gap-fill / interpolation-noise has rho near 0.0..0.5.

| product | posting (m) | size (MB) | median rho | %% < 0.5 | %% NaN | path |
|---|---|---|---|---|---|---|
| ldem.tif (current pipeline, 20 m) | 20.0 | 138.3 | 0.999 | 0.31 | 0.000 | `/home/chandmer/nvme-8tb-2/DEMEnhancement/outputs/s18_apollo17/ldem.tif` |
| LOLA 512 ppd global mosaic VRT (~59 m) | 59.2 | 0.0 | 0.997 | 0.07 | 0.000 | `/home/chandmer/nvme-8tb-2/MoonMapping/LOLA/processing/ldem_512_mosaic.vrt` |
| LRO_LOLA_LDEM_global_128ppd_20100915.cub (~237 m) | 236.9 | 2141.2 | 0.984 | 0.02 | 0.000 | `/home/chandmer/nvme-8tb-2/DEMEnhancement/inputs/isis/base/dems/LRO_LOLA_LDEM_global_128ppd_20100915.cub` |
| ldem_128ppd_Mar2011_clon180_radius_pad.cub (~237 m) | 236.9 | 2141.2 | 0.984 | 0.02 | 0.000 | `/home/chandmer/nvme-8tb-2/DEMEnhancement/inputs/isis/base/dems/ldem_128ppd_Mar2011_clon180_radius_pad.cub` |
| kaguya_LALT_0001.cub (~1895 m) | 1895.2 | 69.4 | 0.931 | 5.73 | 0.000 | `/home/chandmer/nvme-8tb-2/DEMEnhancement/inputs/isis/base/dems/kaguya_LALT_0001.cub` |

## Interpretation

For the Apollo 17 AOI, **ldem.tif (current pipeline, 20 m)** has the highest local lag-1 autocorrelation (median rho = 0.999, NaN fraction = 0.00%), indicating its surface is the smoothest sample of real terrain on disk for this scene. The worst-scoring product is **kaguya_LALT_0001.cub (~1895 m)** (median rho = 0.931). The metric is sensitive to native posting: coarser products score higher because each pixel covers more real ground, but the rank ordering at equal posting reflects how much of the surface is real vs interpolated fill.
LDEM effective-resolution scan updated 51d ago (2026-05-02 21:08) — click to expand · images load on open
LDEM effective-resolution scan
Block-mean downsample LDEM at k in {1, 2, 4, 8, 16, 32, 64, 128} (postings 20-2560 m); per-pixel 9x9 local lag-1 autocorrelation rho at each scale. Surfaces the LDEM's 'honest' resolution -- the scale at which interpolation-fill streaks are averaged out but real terrain coherence still fits in the 9x9 window. Re-run with PYTHONPATH=. python drivers/smoke/dem_entropy_scan.py.
per-scale summary table + interpretation
# LDEM effective-resolution scan -- Apollo 17 AOI

Source: `/home/chandmer/nvme-8tb-2/DEMEnhancement/outputs/s18_apollo17/ldem.tif` (native posting 20.00 m).

Block-mean downsample at decimation factors k in {1, 2, 4, 8, 16, 32, 64, 128}; per-pixel local lag-1 autocorrelation in a 9x9 window (geometric mean of x- and y-direction rho), computed by `drivers.smoke.dem_quality_compare._local_lag1_rho`.

| k | posting (m) | shape | median rho | %<0.5 | %<0.9 | min rho (1st pctile) |
|---:|---:|---|---:|---:|---:|---:|
| 1 | 20.0 | 6065x5699 | 0.9995 | 0.308% | 4.128% | 0.719 |
| 2 | 40.0 | 3032x2849 | 0.9986 | 0.082% | 2.345% | 0.841 |
| 4 | 80.0 | 1516x1424 | 0.9951 | 0.021% | 3.328% | 0.846 |
| 8 | 160.0 | 758x712 | 0.9870 | 0.008% | 7.278% | 0.800 |
| 16 | 320.0 | 379x356 | 0.9736 | 0.040% | 13.725% | 0.735 |
| 32 | 640.0 | 189x178 | 0.9537 | 0.063% | 22.083% | 0.668 |
| 64 | 1280.0 | 94x89 | 0.9198 | 0.172% | 39.301% | 0.626 |
| 128 | 2559.9 | 47x44 | 0.8384 | 1.333% | 81.436% | 0.476 |

## Interpretation

%<0.9 follows a U-shape: the minimum is at posting **40 m** (k = 2x, %<0.9 = 2.34%, median rho = 0.9986, 1st-pctile rho = 0.841). At finer scales (e.g. native 20 m: %<0.9 = 4.13%), residual interpolation streaks from the LDEM's upsampling of a sparser LOLA grid push some cells below 0.9; at coarser scales the 9x9 window starts spanning the real terrain decorrelation length, lowering rho everywhere. The 'honest' posting is therefore ~2x the native posting -- one block-mean step is enough to average out the worst of the interpolation fill, and going coarser starts costing real signal. Note that even at this optimal scale ~2.3% of cells remain below 0.9, so the LDEM is *not* uniformly real-terrain at any tested posting -- it is best described as a 20 m raster whose true entropy lives at ~40-100 m.
S08 alignment diagnostic — click to expand · images load on open
S08 alignment diagnostic — real | synthetic | diff + NCC heatmap (±100 m)
nac.m1417333174le
Generated by drivers/smoke/alignment_s08_diag.py --pid <id>
▶ Photoclinometric quad — NAC · closed-loop syn · K⊛(weight·residual) ·
syn + α·K⊛diff
(click to expand · images load on open · 10 rows)
One row per NAC strip overlapping the AOI. Pane 1 is the decimated
real NAC. Pane 2 is the closed-loop synthetic on the current working
DEM at the same camera lattice. Pane 3 is the post-kernel "topo
delta" — K ⊛ (weight · (NAC − scaled syn)). Pane 4 is
scaled syn + α·K⊛diff with α chosen per-PID by an
in-quad L1 sweep over the well-lit pixels.
▶ Rendering stress test — 8 AOI-overlapping cases × (real
NAC / closed-loop / topo / geometry) (click to expand · images load on open)
Same ground patch (lower-left 5000×5000 of M1320729333RE) imaged
from different LRO orbits with different sun geometry. Active-case
footprint in red, others in orange.
case 0real NAC
PID nac.m1320729333re · sun heading -3.6° · elev 3.11°
case 0closed loop
closed loop (L-S) · wall 6.6s · kernel 0.8s
case 0topo + sun arrow
topo + footprint + sun arrow
case 0geometry
side view: LRO altitude, boresight, velocity, sun (vertical compressed)
case 1real NAC
PID nac.m1433050512le · sun heading -8.8° · elev 5.26°
case 1closed loop
closed loop (L-S) · wall 6.7s · kernel 0.9s
case 1topo + sun arrow
topo + footprint + sun arrow
case 1geometry
side view: LRO altitude, boresight, velocity, sun (vertical compressed)
case 2real NAC
PID nac.m140055312le · sun heading -2.0° · elev 5.71°
case 2closed loop
closed loop (L-S) · wall 4.8s · kernel 0.5s
case 2topo + sun arrow
topo + footprint + sun arrow
case 2geometry
side view: LRO altitude, boresight, velocity, sun (vertical compressed)
case 3real NAC
PID nac.m140062096re · sun heading -3.0° · elev 5.71°
case 3closed loop
closed loop (L-S) · wall 4.8s · kernel 0.5s
case 3topo + sun arrow
topo + footprint + sun arrow
case 3geometry
side view: LRO altitude, boresight, velocity, sun (vertical compressed)
case 4real NAC
PID nac.m109346857le · sun heading +10.8° · elev 5.58°
case 4closed loop
closed loop (L-S) · wall 4.4s · kernel 0.4s
case 4topo + sun arrow
topo + footprint + sun arrow
case 4geometry
side view: LRO altitude, boresight, velocity, sun (vertical compressed)
case 5real NAC
PID nac.m1101504283le · sun heading -32.1° · elev 5.03°
case 5closed loop
closed loop (L-S) · wall 4.7s · kernel 0.5s
case 5topo + sun arrow
topo + footprint + sun arrow
case 5geometry
side view: LRO altitude, boresight, velocity, sun (vertical compressed)
case 6real NAC
PID nac.m111702895re · sun heading +38.6° · elev 4.76°
case 6closed loop
closed loop (L-S) · wall 3.8s · kernel 0.3s
case 6topo + sun arrow
topo + footprint + sun arrow
case 6geometry
side view: LRO altitude, boresight, velocity, sun (vertical compressed)
case 7real NAC
PID nac.m1132228756le · sun heading -47.0° · elev 4.24°
case 7closed loop
closed loop (L-S) · wall 4.8s · kernel 0.5s
case 7topo + sun arrow
topo + footprint + sun arrow
case 7geometry
side view: LRO altitude, boresight, velocity, sun (vertical compressed)
▶ Legacy Malapert-era diagnostics — sun-in-sky · NAC coverage maps · sub-frames
(click to expand · images load on open)
Sun in local sky — AOI-overlapping NAC products
Where the sun was in the AOI's local
sky (east/north/up tangent frame at -85.86°S, 334.6°E) at the
moment each AOI-overlapping product was acquired. x = compass
heading from north (0° N, 90° E, 180° S, 270° W). y = elevation
above the local horizon. Only above-horizon observations are
plotted; sub-horizon observations don't carry usable photometry
for our renderer. The yellow star is M1320729333 at azimuth
356.4° (essentially due-north), elevation 3.11°. The cluster
pattern reflects LRO's repeating ground tracks crossed with the
sun's slow drift in the local sky over the year-and-a-bit
lunar season cycle.
Pipeline:
drivers/smoke/nac_sun_sky.py
→ S07 PushbroomCamera AOI corners → S01 cached ODE query →
WKT polygon overlap test → SPICE
spkpos("SUN", utc, "MOON_ME") →
project sun unit-vector into local east/north/up at AOI →
(azimuth, elevation) scatter.
NAC coverage count — 30 km square at AOI
Coverage count per pixel: how many of the 1666
cached PDS-ODE NAC products' polar-stereographic footprint
polygons (Footprint_SP_geometry, already in SPS
metres so no lat/lon→SPS projection error) contain that ground
point. White × is the AOI centre, red box is the reference
5000×5000 sub-frame. Peak ≈ 142 PDS-archived strips through any
given pixel. Of those, only 4 are downloaded + S03-
calibrated locally (cases 0–3) and thus actually feed
the closed-loop renders — the other ~138 are discoverable but
not yet ingested, which is what the user sees as "only 3-4
actually do". The map measures PDS coverage, not local pipeline
coverage.
NAC coverage near Malapert — south-polar stereographic, AOI-cropped
All 1683 LROC-NAC products with footprints
intersecting ±2° lon × ±0.5° lat around (-85.86°S, 334.6°E),
shown on a south-polar stereographic projection cropped tight
around the AOI (±60 km in SPS metres). Same projection
convention as the renderer. Yellow = pipeline target
M1320729333 (LE + RE). Red = AOI search bbox + centre.
The radial fan-out toward the upper-right is the polar-stereo
signature: meridians become straight lines through the pole,
so the orbit-track precession spreads the strip footprints
around the AOI in a hand-fan.
Native PDS-line cropping of real_full.png
at file rows [0, 5000) × cols [0, 5000) — the full top-5000-line
lower-left 5000-cross-track-sample window. No resampling — one
image pixel = one detector sample × one scan line. Ground truth
target for the two synthetic renders beside it.
Pipeline:
real_full.png[0:5000, 0:5000] via PIL crop.
Native pushbroom 5000 × 5000 (one row per real
CK scan line). Photometry:
I/F = (w/4) · cos_i / (cos_i + cos_e), w = 0.2.
Bilinear normal lookup + bilinear shadow-DEM lookup.
cos_i mean = 0.165 std = 0.080, shadow_frac = 0.053,
I/F max = 0.027. Wall-clock: 8.31 s on RTX 5090
(compiled CUDA kernel: geometry phase 1.3 s, the
remaining ≈7 s is SPICE init + DEM read + 25 M-pixel PNG/npy
write). Earlier numbers reported 0.2 s for the geometry phase —
that was a measurement artefact: the timer was reading the time
to queue launches on the CUDA stream, not the time to
execute them. Now synced via
torch.cuda.synchronize() before the timer
stops.
12 × 7 km ground patch around the AOI, top-down
Lambertian hillshade at a fixed 45°-NW sun (synthetic — for
readability, not photometric truth).
Red outline = NAC top-5000-line
ground footprint, ray-projected through the actual S07 camera
pose. The arrow shows the LRO ground-track direction. Useful
as a context map: where the strip we're rendering sits on the
DEM, and what topography is inside it.
Pipeline:
drivers/smoke/relief_shade.py (numpy
central-difference gradients → Lambertian cos(i) at fixed
sun) + the SPICE-ray-projected NAC corner polygon
(nac_footprint_top5k.json) overlaid as a
polyline.